The world today has a much different economic landscape than just 20 years ago. China’s amazing economic growth is likely the biggest story. But the overwhelming success of many other countries is also a huge story. Today it is not the developing world that has governments spending taxes they promise their grandchildren will pay, but instead the richest countries on earth that choose to spend today and pay tomorrow. While “developing” countries have well balanced government budgets overall.
 The chart shows gross government debt as percentage GDP from 1990-2009. By Curious Cat Investing and Economics Blog, Creative Commons Attribution. Data source: IMF
___________________________
There are plenty of reasons to question this data but I think it gives a decent overall picture of where things stand. It may seem like government debt should be an easy figure to know but even just agreeing what would be the most reasonable figure for one country is very difficult, comparing between countries gets even more difficult and the political pressures to reduces how bad the data looks encourages countries to try and make the figures look as good as they can.
The poster child for irresponsible spending is Japan which has gross government debt of 218% of GDP (Japan’s 2009 figure is an IMF estimate). Greece is at 115%. Gross debt is not the only important figure. Government debt held within the country is much less damaging than debt held by those outside the country. Japan holds a large portion of its own debt. If foreigners own your debt then debt payments you make each year are paid outside your country and it is in essence a tax of a portion of your economic production that must be paid. If the debt is internal it mean taxpayers have to support bond holders each year (but at least when those bondholders spend the money it stays within your economy).
Read more
In previous posts I have shown data for global manufacturing output by country. One of the things those posts have showed is that manufacturing output in China is growing tremendously, but it is also growing in the United States. The chart below shows manufacturing production by country as a percent of GDP. China dominates again, with over 30% of the GDP from manufacturing.

Chart showing manufacturing output, as percent of GDP, by country was created by the Curious Cat Economics Blog based on UN data* (based on current USA dollars). You may use the chart with attribution.
For the 14 biggest manufacturing countries in 2008, the overall manufacturing GDP percentage was 23.7% of GDP in 1980 and dropped to 17% in 2008. I left India (15% in 1980, 15% in 2008), Mexico (20%, 18%), Canada (17%, 13%), Spain (25%, 14%) and Russia (21% in 1990 [it was part of USSR in 1980], 15%) off the chart.
Over the last few decades Korea, and to some extent China, are the only countries that have increased the percent of GDP from manufacturing. China has not only grown manufacturing activity tremendously but also other areas of the economy (construction, mining, information technology). The countries with the largest manufacturing portions of their economies in 2008 were: China 32%, South Korea 25%, Japan and Germany at 21%. The next highest is Mexico at 18% which declined slightly over the last 15 years (with NAFTA in place). Globally, while manufacturing has grown, other areas of economic activity have been growing faster than manufacturing.
The manufacturing share of the USA economy dropped from 21% in 1980 to 18% in 1990, 16% in 2000 and 13% in 2008. Still as previous posts show the USA manufacturing output has grown substantially: over 300% since 1980, and 175% since 1990. The proportion of manufacturing output by the USA (for the top 14 manufacturers) has declined from 31% in 1980, 28% in 1990, 32% in 2000 to 24% in 2008. The proportion of USA manufacturing has declined from 33% in 1980, 29% in 1990, 36% in 2000 to 30% in 2008. While manufacturing output has grown in the USA it has done so more slowly than the economy overall.
Related: The Relative Economic Position of the USA is Likely to Decline – Manufacturing Data, Accuracy Questions – Top 12 Manufacturing Countries in 2007 – Manufacturing Employment Data: 1979 to 2007 – USA Manufacturing Output Continues to Increase (over the long term)
* I made edits to the 1980 Brazil manufacturing data and 1980, 1985 and 2008 China manufacturing data because the UN data only showed manufacturing data combined with mining and utility data. And I am using older UN data that had manufacturing separated from mining and utility figures for China in the other years.
The chart shows the total percent of delinquent loans by commercial banks in the USA.

That last half of 2009 saw real estate delinquencies continue to increase. Residential real estate delinquencies increased 143 basis points to 10.14% and commercial real estate delinquencies in 98 basis points to 8.81%. Agricultural loan delinquencies also increased (112 basis points) though to just 3.24%. Consumer loan delinquencies decreased with credit card delinquencies down 18 basis points to 6.4% and other consumer loan delinquencies down 19 basis points to 3.49%.
Related: Loan Delinquency Rates Increased Dramatically in the 2nd Quarter – Bond Rates Remain Low, Little Change in Late 2009 – Government Debt as Percentage of GDP 1990-2008 – USA, Japan, Germany… – posts with charts showing economic data
Read more
Once again the USA was the leading country in manufacturing in 2008. And once again China grew their manufacturing output amazingly. In a change with recent trends Japan grew output significantly. Of course, the 2009 data is going to show the impact of a very severe worldwide recession.
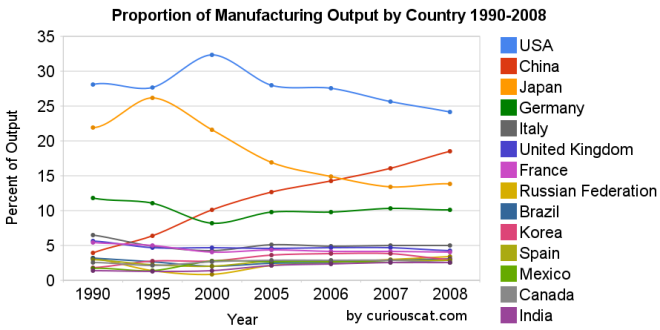 Chart showing the percentage output of top manufacturing countries from 1990-2008 by Curious Cat Management Blog, Creative Commons Attribution.
The first chart shows the USA’s share of the manufacturing output, of the countries that manufactured over $185 billion in 2008, at 28.1% in 1990, 27.7% in 1995, 32% in 2000, 28% in 2005, 28% in 2006, 26% in 2007 and 24% in 2008. China’s share has grown from 4% in 1990, 6% in 1995, 10% in 2000, 13% in 2005, 14% in 2006, 16% in 2007 to 18% in 2008. Japan’s share has fallen from 22% in 1990 to 14% in 2008. The USA has about 4.5% of the world population, China about 20%. See Curious Cat Investment blog post” Data on the Largest Manufacturing Countries in 2008.
Even with just this data, it is obvious the belief in a decades long steep decline in USA manufacturing is not in evidence. And, in fact the USA’s output has grown substantially over this period. It has just grown more slowly than that of China (as has every other country), and so while output in the USA has grown the percentage with China has shrunk. The percentage of manufacturing output by the USA (excluding output from China) was 29.3% in 1990 and 29.6% in 2008. The second chart shows manufacturing output over time.
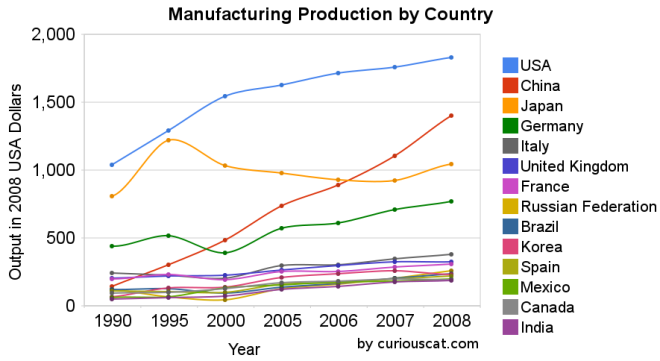 Chart showing the output of the top manufacturing countries from 1990-2008 by Curious Cat Management Blog, Creative Commons Attribution.
The 2008 China data is not provided for manufacturing alone (the latest UN Data, for global manufacturing, in billions of current USA dollars). The percentage of manufacturing (to manufacturing, mining and utilities) was 78% for 2005-2007 (I used 78% of the manufacturing, mining and utilities figure provided in the 2008 data). There is a good chance this overstates China manufacturing output in 2008 (due to very high commodity prices in 2008).
Hopefully these charts provide some evidence of what is really going on with global manufacturing and counteracts the hype, to some extent. Global economic data is not perfect. These figures are an attempt to capture the economic reality in the world but they are not a perfect proxy. This data is shown in 2008 USA dollars which is good in the sense that it shows all countries in the same light and we can compare the 1995 USA figure to 2005 without worrying about inflation. However foreign exchange fluctuations over time can show a country, for example, having a decline in manufacturing output in some year when in fact the output increased (just the decline against the USA dollar that year results in the data showing a decrease – which is accurate when measured in terms of USA dollars).
If the dollar declines substantially between when the 2008 data was calculated and the 2009 data is calculated that will give result in the data showing a substantial increase in those countries that had a currency strengthen against the USA dollar. At this time the Chinese Renminbi has not strengthened while most other currencies have – the Chinese government is retaining a peg to a specific exchange rate.
Korea (1.8% in 1990, 3% in 2008), Mexico (1.7% to 2.6%) and India (1.4% to 2.5%) were the only countries to increase their percentage of manufacturing output (other than China, of course, which grew from 3.9% to 18.5%).
Related: posts on manufacturing – Global Manufacturing Data by Country (2007) – Global Manufacturing Employment Data – 1979 to 2007 – Top 10 Manufacturing Countries 2006 – Top 10 Manufacturing Countries 2005
Manufacturing is an powerful driver of economic wealth. For years I have been providing data to counter the contention that the manufacturing base of the USA is gone and the little bit left was shrinking. The latest data again shows the USA is the largest manufacturer, and manufacturing in the USA continues to grow. It is true global manufacturing has begun to grow more rapidly than USA manufacturing in the last few years. I doubt many suspect that the USA’s share of manufacturing stayed stable from 1990 to 1995 then grew to 2000 took until 2006 to return to the 1990-1995 levels and then has declined in 2007 and 2008 a bit below the 1990 level and during that entire time was growing (even in 2007 and 2008).
The USA’s share of the manufacturing output, of the countries that manufactured over $185 billion in 2008, 28% in 1990, 28% in 1995, 32% in 2000, 28% in 2005, 28% in 2006, 26% in 2007 and 24% in 2008. China’s share has grown from 4% in 1990, 6% in 1995, 10% in 2000, 13% in 2005, 14% in 2006, 16% in 2007 to 18% in 2008. Japan’s share has fallen from 22% in 1990 to 14% in 2008 (after increasing to 26% in 1995 then steadily falling). The USA has about 4.5% of the world population, China about 20%.
Based on the latest UN Data, for global manufacturing, in billions of current US dollars:
| Country | 1990 | 1995 | 2000 | 2005 | 2006 | 2007 | 2008 |
|---|---|---|---|---|---|---|---|
| USA | 1,041 | 1,289 | 1,543 | 1,624 | 1,712 | 1,756 | 1,831 |
| China | 145 | 300 | 484 | 734* | 891* | 1,106* | 1,399** |
| Japan | 810 | 1,219 | 1,034 | 979 | 927 | 923 | 1,045 |
| Germany | 438 | 517 | 392 | 571 | 608 | 711 | 767 |
| Italy | 240 | 226 | 206 | 295 | 302 | 345 | 381 |
| United Kingdom | 206 | 218 | 226 | 264 | 295 | 323 | 323 |
| France | 200 | 233 | 190 | 255 | 255 | 287 | 306 |
| Russian Federation | 120 | 64 | 45 | 124 | 157 | 206 | 256 |
| Brazil | 120 | 125 | 96 | 137 | 163 | 201 | 237 |
| Korea | 66 | 131 | 136 | 211 | 234 | 260 | 231 |
| Spain | 112 | 104 | 98 | 160 | 170 | 196 | 222 |
| Mexico | 62 | 67 | 133 | 154 | 175 | 182 | 197 |
| Canada | 92 | 100 | 129 | 168 | 182 | 197 | 195 |
| India | 51 | 61 | 69 | 122 | 141 | 177 | 188 |
* I am using the data from last year that separated the manufacturing data (this year the data does not provide separate manufacturing data for China) instead of that shown in the most recent data (which doesn’t separate manufacturing)
** The China data is not provided for manufacturing alone. The percentage of manufacturing (to manufacturing, mining and utilities) was 78% for 2005-2007 (I used 78% of the manufacturing, mining and utilities figure provided in the 2008 data).
I hope to write a series of posts examining global manufacturing data including looking at manufacturing data specifically (excluding mining and utility data).
Read more
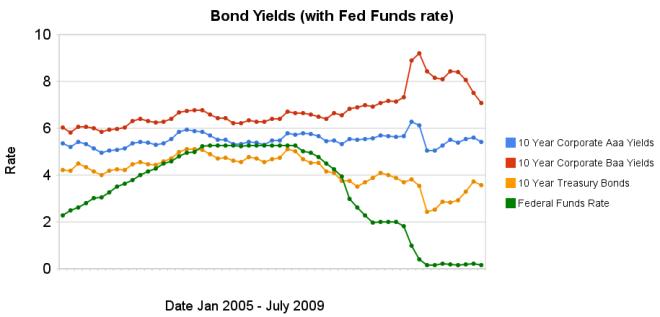 Chart showing corporate and government bond yields by Curious Cat Investing Economics Blog, Creative Commons Attribution, data from the Federal Reserve.
The changes in bond yields over the last 3 months months indicate a huge increase in investor confidence. The yield spread between corporate Baa 10 year bonds and 10 year treasury bonds increased 304 basis points from July 2008 to December 2008, indicating a huge swing in investor sentiment away from risk and to security (US government securities). From April 2009 to July 2009 the yield spread decreased by 213 basis points showing investors have moved away from government bonds and into Baa corporate bonds.
From April to July 10 year corporate Aaa yields have stayed essentially unchanged (5.39% to 5.41% in July). Baa yields plunged from 8.39% to 7.09%. And 10 year government bond yields increased from 2.93% to 3.56%. federal funds rate remains under .25%.
Investors are now willing to take risk on corporate defaults for a much lower premium (over government bond yields) than just a few months ago. This is a sign the credit crisis has eased quite dramatically, even though it is not yet over.
Data from the federal reserve: corporate Aaa – corporate Baa – ten year treasury – fed funds
Related: Continued Large Spreads Between Corporate and Government Bond Yields (April 2009) – Chart Shows Wild Swings in Bond Yields (Jan 2009) – investing and economic charts
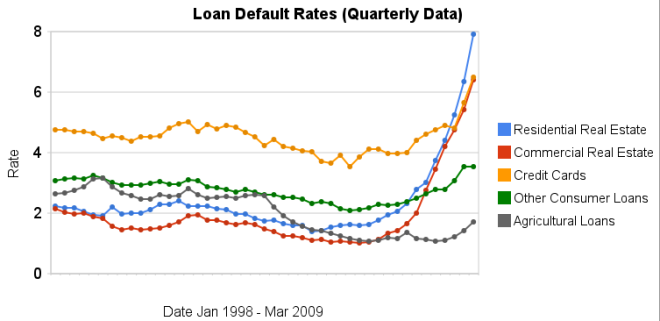 Chart showing loan default rates for real estate, consumer and agricultural loans for 1998 to 2009 by the Curious Cat Investing Economics Blog, Creative Commons Attribution, data from the Federal Reserve.
As you can see real estate default rates exploded in 2008. In the 4th quarter of 2007 residential default rates were 3.02% by the 4th quarter of 2008 they were 6.34% and in the 1st quarter of this year they were 7.91% (471 basis points above the 4th quarter of 2007). Commercial real estate default rates were at 2.74 in the 4th quarter of 2007, 5.43% in the fourth quarter of 2008 and 6.5% in the 1st quarter of 2009 (a 366 basis point increase).
Credit card default rates were much higher for the last 10 years (the 4-5% range while real estate hovered above or below 2%). In the last 2 quarters it has increased sharply. From 4.8% in the 3rd quarter 2008 to 5.66% in the 4th and 6.5% in the 1st quarter of 2009. The default rate on other consumer loans are up but nowhere near the amounts of real estate or credit cards.
Agricultural loan default rates are actually about as low now as they have every been 1.71%. That is up a bit from the 1.06% low the default rate hit in the 1st quarter of 2009 but actually lower than it was for half of the last decade (the last 5 years it has been lower but prior to that it was higher – in fact with higher default rates than either real estate loan category).
Related: Mortgage Rates: 6 Month and 5 Year Charts – Jumbo Loan Defaults Rise at Fast Pace – Continued Large Spreads Between Corporate and Government Bond Yields – Nearly 10% of Mortgages Delinquent or in Foreclosure
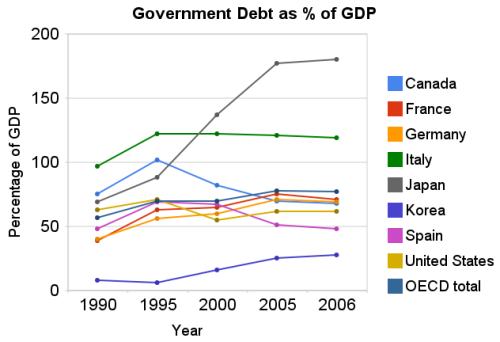 Chart showing government debt as a percentage of GDP by Curious Cat Investing Economics Blog, Creative Commons Attribution, data from OECD, March 2009.
The USA federal government debt is far too large, in my opinion. We have been raising taxes on future taxpayers for several decades, to finance our current spending. Within reason deficit spending is fine. What that reasonable level is however, is not easy to know. One big problem with the past few decades is that during very prosperous economic times we spent money that we didn’t have, choosing to raise taxes on the future (instead of either not spending as much or paying for what we were spending by raising taxes to pay for current spending).
By not even paying for what we are spending when times were prosperous we put ourselves in a bad situation when we have poor economic conditions – like today. If we were responsible during good economic times (and at least paid for what we spent) we could have reduced our debt as a percentage of GDP. Even if we did not pay down debt, just by not increasing the outstanding debt while the economy grew the ratio of debt to GDP would decline. Then when times were bad, we could afford to run deficits and perhaps bring the debt level up to some reasonable level (maybe 40% of GDP – though it is hard to know what the target should be, 40% seems within the realm of reason to me, for now).
There is at least one more point to remember, the figures in the chart are based on reported debt. The USA has huge liabilities that are not accounted for. So you must remember that the actually debt is much higher than reported in the official debt calculation.
Now on to the good news. As bad as the USA has been at spending tomorrows increases in taxes today, compared to the OECD countries we are actually better than average. The OECD is made up of countries in Europe, the USA, Japan, Korea, Australia, New Zealand and Canada. The chart shows the percentage of GDP that government debt represents for various countries. The USA ended 2006 at 62% while the overall OECD total is 77%. In 1990 the USA was at 63% and the OECD was at 57%. Japan is the line way at the top with a 2006 total of 180% (that is a big problem for them). Korea is in the best shape at just a 28% total in 2006 but that is an increase from just 8% in 1990.
Related: Federal Deficit To Double This Year – Politicians Again Raising Taxes On Your Children – True Level of USA Federal Deficit – Who Will Buy All the USA’s Debt? – Top 12 Manufacturing Countries in 2007 – Oil Consumption by Country
Read more
Health spending in the United States grew 6.1 percent in 2007, to $2.2 trillion or $7,421 per person.
For comparison the total GDP per person in China is $6,100. This continues the trend of health care spending taking an every increasing portion of the economic output (the economy grew by 4.8 percent in 2007). This brings health care spending to 16.2% of GDP (which is yet another, in a string of record high percentages of GDP spent on health care). In 2003 the total health care spending was 15.3 of GDP.
With the exception of prescription drugs (which grew at 1.4% in 2007, compared to the 3.5% in 2006), spending for most other health care services grew at about the same rate or faster than in 2006. Hospital spending, which accounts for about 30 percent of total health care spending, grew 7.3 percent in 2007, compared to 6.9 percent in 2006.
Spending growth for both nursing home and home health services accelerated in 2007 (4.8% v. 4.0%). Spending growth for freestanding home health care services increased to 11.3 percent. Total health care spending by public programs, such as Medicare and Medicaid, grew 6.4% in 2007 v. 8.2% in 2006. In comparison, health care spending by private sources grew 5.8% compared to 5.4%.
Private health insurance premiums grew 6.0 percent in 2007, the same rate as in 2006. Out-of-pocket spending grew 5.3 percent in 2007, an acceleration from 3.3 percent growth in 2006. Out-of-pocket spending accounted for 12.0 percent of national health spending in 2007. This share has been steadily declining both recently and over the long-run; in 1998, it accounted for 14.7 percent of health spending and, in 1968, out-of-pocket spending accounted for 34.8 percent of all health spending.
The costs for health services and supplies for 2007 were distributed among businesses (25%), households (31%), other private sponsors (4%), and governments (40%).
Decades ago Dr. Deming included excessive health care costs as one of the seven deadly diseases of western management. We have only seen the problem get worse. Finally it seems that a significant number of people are in agreement that the system is broken. Still, admitting the system is broken is not the same as agreeing on how to fix it. The way forward to workable solutions still seems very difficult.
Full press release from the United States Department of Health and Human Services.
Related: International Health Care System Performance – Personal Finance Basics: Health Insurance – Many Experts Say Health-Care System Inefficient, Wasteful – How to Improve the Health Care System
Since August of 2008 conforming mortgage rates are have declined a huge amount. Jumbo rates have fallen a large amount also, but much less (for example for a credit score of 700-759 the jumbo rates declined 73 basis points while the conventional rate declined 172 basis points.
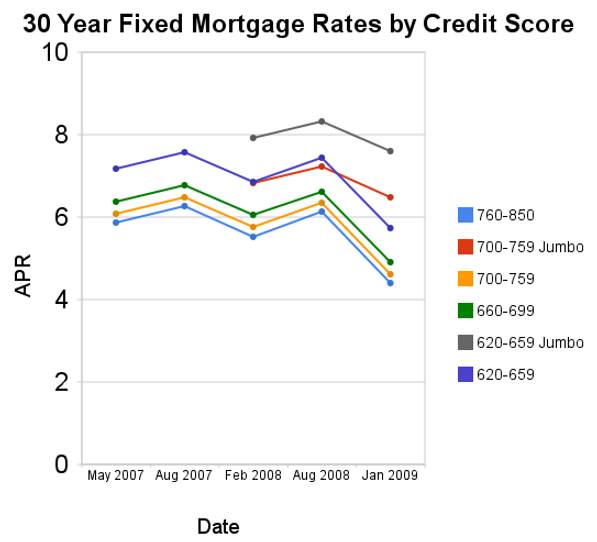
For scores above 620, the APRs above assume a mortgage with 1 point and 80% Loan-to-Value Ratio. For scores below 620, these APRs assume a mortgage with 0 points and 60 to 80% Loan-to-Value Ratio. You can see, with these conditions the rate difference between a credit score of 660 and 800 is not large (remember this is with 20% down-payment) and has not changed much (the difference between the rates if fairly consistent).
Related: Low Mortgage Rates Not Available to Everyone – 30 Year Fixed Rate Mortgage Rate Data – Real Free Credit Report (in USA) – Jumbo Mortgage Shoppers Get Little Relief From Rates – posts on mortgages
Read more