Amazon announced they are opening major new offices in Arlington, Virginia and New York City. Each site will hold 25,000 new Amazon employees at an average salary above $150,000. Getting to that level with take many years, next year under 1,000 employees will be at each site.
I lived in Arlington for many years and own rental property there. The Amazon decision is likely to catalyze a much more rapid ascent of the technology sector in the DC area. The DC area has a strong foundation of internet technology to build upon, though many people are not aware of this. The Amazon move will likely help shift the perception of the DC area as government driven and the growth of internet technology activity in the area is likely to grow rapidly.
The 25,000 jobs (even with a greater than average salary of $150,000) isn’t the main impact of the announcement. The big news is the likelihood of Amazon’s highly visible efforts catalyzing more tech businesses (especially 5-7 years down the road when some of the Amazon people start creating their own startups). It isn’t that Amazon is moving into a barren tech landscape, there is already a strong base from which to launch a long term tech boost to the DC area economy.
The direct impact of Amazon’s employees renting and buying in and around Arlington is not going to be very strong for a couple years. Amazon plans to add 500 people to Arlington in 2019; 1,000 more in 2020 and 2,000 more in 2021. But investors already can plan for a strong future demand from Amazon and all the activity that Amazon’s growing presence will contribute to.

I am actually selling my house in Arlington (in this photo), with a very nice yard (explanation below).
The increase in housing prices in 2019 and 2020 will be primarily investor driven. In 2020, 2021 and going forward the impact of Amazon employees directly and all the extra activity spurred on will start to have an impact. Unlike the stock market where such a predicable strong investment future would drive prices up say 30-50% immediately, in real estate it is much more likely for the gains to be spread out over the long term.
If prices in housing increase in Arlington it is more likely they would increase say 10% in the first year and then an extra 3% (above what the increase would have been without Amazon’s move) each of the next 10 years. From a long term investors perspective this provides a great possibility for buying now (even after the news) and not having to pay a huge premium.
Rental housing prices are not likely to go up much immediately. And they will take longer to show up in the market, they will be much more closely tied to new job additions (from Amazon and others). So investors have to pay a higher price today (say 5-10% higher) and in the first 1 or 2 years probably see no higher rents than they would have otherwise. And even after 2021 those rents are likely to go up more slowly than prices of real estate.
The stories you most frequently hear about China in Africa are
- resource extraction (oil, metals, etc.)
- infrastructure loans from China (with Chinese labor and Chinese companies doing the work, often to aid resource extraction)
- farming exports to China
While those are happening an excellent report from McKinsey (Dance of the Lions and Dragons) provides an in depth look at a much more entrepreneurial state of affairs. While there are big government backed efforts (including those with Chinese state owned company participation) there are many small companies making entrepreneurial investments led by Chinese entrepreneurs seeing a opening to build successful companies.
Chinese firms’ decisiveness is indicative of the relationship between the comparative advantages of Chinese entrepreneurs and the opportunities in African markets. To some, the high returns earned by Chinese firms are symptomatic of a market failure: too little competition in African markets. But in sectors such as manufacturing, there are too few African firms with the capital, technology, and skills to invest successfully and too few Western firms with the risk appetite to do so in Africa. Thus the opportunities are reaped by Chinese entrepreneurs who have the skills, capital, and willingness to live in and put their money in unpredictable developing-country settings.
What makes the decisiveness of Chinese investors all the more impressive is that they are mostly using their own money. Two-thirds of the private firms we surveyed, and over half of all firms in our sample, reported that their investments were self-financed through retained earnings or savings, or funded through personal loans. Only 13 percent of investment funds came from financing schemes linked to the Chinese government, and less than 20 percent came from Chinese or African commercial bank loans
I believe investments in Africa will provide great investment returns in the next 20 years. There are many challenges but the opportunity is much greater than most people realize. The potential returns are quite high due to the lack of capital and interest being shown in African opportunities.

Factory in Nigeria (I think) that my family toured.
Likely huge companies, such as Google, Tencent, Facebook, Toyota and Alibaba will do very well. But there are many opportunities. That Africa is made up of 54 different countries creates challenges for investors and companies seeking to grow (but also creates variation and opportunities). It will be interesting to see how big the role Chinese entrepreneurs play in the next 20 years in Africa.
The report is an excellent detailed look at Chinese investment in Africa. It is a long and worthwhile read.
Related: Kiva Loans Give Entrepreneurs a Chance to Succeed – Drone Deliveries to Hospitals in Rwanda – Using Capitalism in Mali to Create Better Lives – Promoting Innovation in Sierra Leone
I created a 10 stocks for 10 years portfolio in April of 2005 which I shared on this blog. It did very well.
Over the years I adjusted the portfolio occasionally. Unfortunately the website I used to track results stopped doing that (and it is much more difficult to track results – with dividends, stock splits, spinoff… than you might suppose). I estimate I beat the S&P 500 by maybe 300 basis points annually (for the portfolio with slight adjustment over time, which is the one I tracked).
With this post I have created a new 10 stocks for 10 years portfolio.
The 10 stocks I came up with are (closing price on 22 April 2005 – % of portofilo invested):
- Tencent (TCEHY) – $43 and 15% (using the USA ADR). A phenomenal company with incredible global prospects for the long term. As the stock price has been hampered by concerns about China it has great potential for appreciation from the current price.
- Alibaba (BABA) – $175 and 15% (using USA ADR). Another phenomenal company with incredible global prospects that has performed poorly this year due to China concerns.
- Alphabet (GOOGL) – $1,254 and 11% (in the original 2005 portfolio the price was $216 and it started at 12% of the portfolio. The prospects are great long term, the stock price reflects that so it isn’t cheap but over the long term I expect it to do very well).
- Apple (AAPL) – $225 and 11% (I added Apple to the original 10 for 10 portfolio in 2010. The biggest mistake in the original portfolio was leaving off Apple, I considered it but chose not to include it. It has been my largest stock holding for years. It has been very cheap even just a few years ago, though today I think the price is much more reasonable so it isn’t the great bargin it has been. Still the long term prospects are great.)
- Abbvie (ABBV) – $97 and 10% (I added Abbive to the original portfolio in 2014. I would select a couple other healthcare stocks in a real invested portfolio for balance but Abbvie is the company I am most comfortable with so I include it here.)
- Toyota (TM) $125 and 9% (in the 2005 portfolio the price was $72 and it made up 12% of the portfolio). I believe the company is very well managed and the long term prospects are good though I am a bit worried about autonomous cars and the future of transportation. A potential new market for Toyota is robotics but they have not been as aggressive with software development innovation as I would hope on that front. The companies I am most interested in are very internet focused and I don’t like how concentrated that makes this portfolio so adding Toyota and Abbive adds a bit of diversity, though obviously not much)
- Amazon (AMZN) – $2,002 and 8% (in the 2005 portfolio the price was $33 a share, it was by far the best performer. It started as 8% of the original 2005 portfolio. I am very high on the prospects for the company, the stock price is what leads me to limit it to 8% of the new portfolio.)
- Naspers (NPSNY) – $33 and 8% (bought 30 October 2018, the company is largely a proxy for Tencent but also has many other significant investments in internet companies, the decline in Tencent, along with the Chinese market decline, and therefore the decline in Naspers just makes it too good an opportunity to pass up)
- Vanguard Health Care Index Fund (VHT) – $177 and 8% (I can’t decide on what other health care stock to hold for 10 years but I believe strongly in global growth of health care investments over the next 10 years so I settled on this low expense ETF.)
- Danaher (DHR) – $103 and 5% (I like this company but honestly the biggest reason for including it is to get some more diversity in the portfolio. I added it to the 2005 portfolio in 2008.)
I strongly believe that 10 years from now the Chinese stock market will have performed extremely well. There are of course numerous substantial worries about Chinese investments (the real estate bubble, high debt levels, “Great Firewall”, difficult government regulatory environment, restrictions on the press, restrictions on open debate…) but there are many reasons to be very optimistic about the long term prospects for China’s economic growth and the very promising leading companies prospects: such as Tencent, Alibaba, Baidu, Ctrip….
At this time it seems to me that the stock prices of leading Chinese companies are being held down compared to other leading companies (Apple, Google, Amazon…). Either the USA companies are overvalued or the Chinese ones are very under-valued or the global economy outside the USA is going to do very poorly in the next 10 years. Google, Apple etc. make a huge amount overseas but they have more earnings in the USA than Tencent and Alibaba (which still have almost none in the USA though their global business, outside China, is growing extremely rapidly).
One very big factor that I believe will support Chinese stock prices over the next 10 to 20 years is an large increase in the holdings of stocks by those in China. The current distribution of savings in China has extremely limited stock investments (and much larger bank savings accounts and real estate investments than in other countries). I expect that to change with a large increase in stock investing in China over the next 10 to 20 years.
Two other companies that are interesting are Naspers (which owns a huge amount of Tencent) and Softbank (which owns a large amount of Alibaba). Softbank has a large portfolio of investments in leading technology companies globally though much of it is held in a somewhat complicated manner. Naspers is more focused but also has a strong global portfolio. One of the very important aspects of Alibaba and Tencent is their huge portfolio of technology company investments made at the venture capital stage mostly (Google also has quite a few more investments than most people realize). I also believe Vanguard Emerging Market ETF (VWO) is a very good long term investment.
I wouldn’t be surprised if Chinese stocks had difficulty in the next year or two but long term stocks such as Alibaba and Tencent offer the best prospects considering realistic expectations for possible rewards compared to the risk investing in them poses today.
This portfolio is not meant to be a complete personal financial portfolio (at most it would be a portion of the portfolio allocated to equity holdings). Previous posts on portfolio allocation: Investment Risk Matters Most as Part of a Portfolio, Rather than in Isolation, Investment Options Are Much Less Comforting Than Normal These Days (2013) and Investing Return Guesses While Planning for Retirement.
Abuse of the credit system by 3rd party collection agencies (and credit reporting agencies) in the USA has been a long term problem.
An attempt to partially address some of the abuses was a change in the required reporting practices that impacted collections accounts specifically, known as the National Consumer Assistance Plan (NCAP), which rolled into effect during the second half of 2017. The plan has many components, including: (1) a requirement for more frequent, detailed, and accurate reporting of collections accounts, including reflecting when those accounts have been paid; (2) a prohibition against reporting debts that did not arise from an agreement to pay, or from, medical collections less than 180 days old; (3) the removal of collections accounts that did not arise from a contract or agreement to pay; and (4) permission to report any account only when there is sufficient information to link the account with an individual’s credit files (requiring a name, address, and some other personally identifying information such as a Social Security number or date of birth).
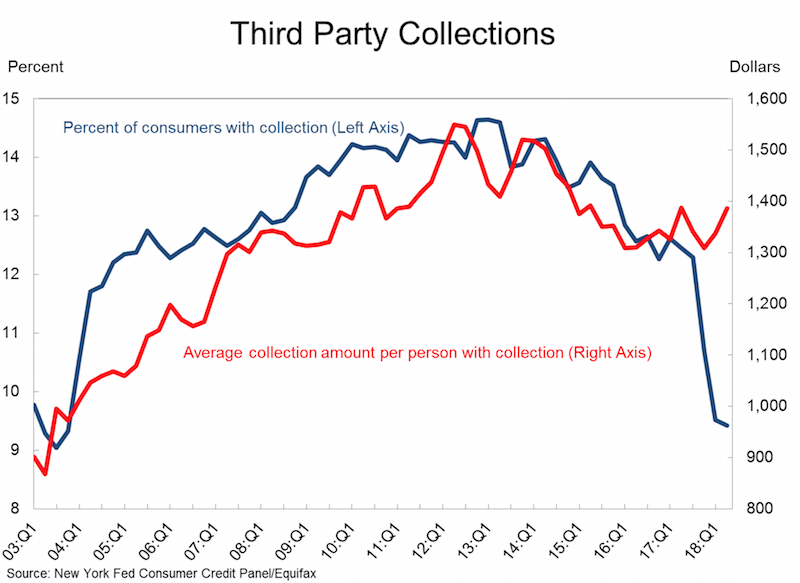
All in all, the changes in credit reporting prompted by the National Consumer Assistance Plan have resulted in an $11 billion reduction in the collections accounts balances being reported on credit reports. A total of 8 million people had collections accounts completely removed from their credit report. However, collections accounts do indeed align with other negative events and the cleanup of collections accounts had the largest impact on the borrowers with the lowest scores.
These borrowers will certainly benefit in the long run from the cleanup of their credit reports, since higher scores are associated with better access to credit, to the job market, and even to the rental housing market. But the immediate impact of the removal of collections will be muted for most of those affected (other items are also impacting their current credit score).
In the longer-term there may be a rebound in collections account reporting because creditors will likely begin collecting the newly required personally identifying information as they adjust to this reporting change.
This was a small good step in protecting consumers from the bad behavior of credit reporting companies and their customers. But much more must be done to protect us from having our financial lives negatively impacted by bad practices of the credit reporting companies.
Related: Cleaning Up Collections – Avoiding the Vicious Cycle of Credit Problems – Truly Free Credit Report – USA Household Debt Jumps to Record $13.15 Trillion
Factfulness by Hans Rosling (of TED talks and Gapminder charts fame) is an exceptionally good book. It provides great insight into how to think more effectively and how to understand the reality of the world we live in (versus the large distortions so common in most people’s vision of the world). You can take a quick quiz to see how well you understand the world
The truth of the very widespread increase in wealth around the globe has influenced my investing strategy for decades. It should be influencing yours, is it?
Data is extremely valuable in helping us make decisions and evaluating the effectiveness of policy. However it is critical to be careful. It is very easy to focus on meeting targets that seem sensible – increasing the number of hospital beds – but that lead to less effective policy.
Dollar street provides photos of people at all 4 income levels from around the globe. This illustrates Hans’ point that what determines how people live and what their circumstances look like is mostly a matter of income not the country they live in. It is simple idea but one that runs counter to much of the economic discussion focused so much on national boundaries. National boundaries do matter and the laws and economic reality of the national economy has a large impact but the issues for people at each level of income are much more tied to those in their level of income anywhere in the world than they are tied to their nation.

The book relentlessly points out the great progress that has been made globally over the last 50 years and how that progress continues today and looks to be set to continue in the future. We have plenty of areas to work on improving but we should be aware of how much progress we have been making. As he points out frequently he has continually seen huge underestimation of the economic conditions in the world today. This book does a great job of presenting the real success we have achieved and the progress we can look forward to in the future.
* In 2017
Level 1 has 0.75 billion people living on less than $2 per day.
Level 2 has 3.3 billion people living on incomes between $2 to $8 per day.
Level 3 has 2.5 billion people living on $8 to $32 per day.
Level 4 has 0.9 billion people living on more than $32 per day.
Related: GDP Growth Per Capita for Selected Countries from 1970 to 2010 (Korea, China, Singapore, Brazil) – Stock Market Capitalization by Country from 2000 to 2016 – Ignorance of Capitalism Leads us Astray – Wealthiest 1% Continue Dramatic Gains Compared to Everyone Else
The Federal Reserve Bank of New York’s Center for Microeconomic Data today issued its Quarterly Report on Household Debt and Credit, which reported that total household debt increased by $193 billion (1.5%) to $13.15 trillion in the fourth quarter of 2017. This report marks the fifth consecutive year of positive annual household debt growth. There were increases in mortgage, student, auto, and credit card debt (increasing by 1.6%, 1.5%, 0.7% and 3.2% respectively) and another modest decline in home equity line of credit (HELOC) balances (decreasing by 0.9%).
Outstanding consumer debt balances by type: $8.88 trillion (mortgage), $1.38 trillion (student loans), $1.22 trillion (auto), $834 billion (credit card), $444 (HELOC).
Mortgages are the largest form of household debt and their increase of $139 billion was the most substantial increase seen in several quarters. Unlike overall debt balances, which last year surpassed their previous peak reached in the third quarter of 2008, mortgage balances remain 4.4% below it. The New York Fed issued an accompanying blog post to examine the regional differences in mortgage debt growth since the previous peak.

As of December 31, 4.7% of outstanding debt was in some stage of delinquency. As the chart shows mortgage and credit card debt delinquency rates have decreased sharply since 2010. Student loan debt delinquency rates have increased substantially during the same period (and delinquency rates for student loans are likely to understate effective delinquency rates because about half of these loans are currently in deferment, in grace periods or in forbearance and therefore temporarily not in the repayment cycle. This implies that among loans in the repayment cycle delinquency rates are roughly twice as high). You can understand why many see student debt as a huge economic problem the economy is facing in the coming years.
Of the $619 billion of debt that is delinquent, $406 billion is seriously delinquent (at least 90 days late or “severely derogatory”). The flow into 90+ days delinquency for credit card balances has been increasing notably from the last year and the flow into 90+ days delinquency for auto loan balances has been slowly increasing since 2012.
Apple analysts are of no value to investors
If the stock moved more than 2% on any uptick in volume, I had to write a story explaining why. After dealing with that every day for about three years, I realized the overwhelming majority of analysts had no better clue than I did about what was moving Cisco’s stock.
Most investors know this, but if you don’t remember this lesson. The “explanations” you hear from media often are just as useless as horoscopes. A bunch of meaningless words presented in the hopes you don’t realize they are empty words.
The talking heads (and writers) need to say something. It would be much more useful if they took the time to do some research and put in some thought but they seem to be driven by the need to fill space instead of the need to inform.
It is also a huge waste of time, explaining random variation.
Related: Fooled by Randomness – Seeing Patterns Where None Exists – Illusions, Optical and Other – Understanding Data
The most popular posts on the Curious Cat Investing and Economics blog in 2017 (based on page views).
- Default Rates on Loans by Credit Score (2015)
- Top 10 Countries for Manufacturing Production in 2010: China, USA, Japan, Germany… (posted in 2011)
- USA Health Care Spending 2013: $2.9 trillion $9,255 per person and 17.4% of GDP (2015) (
- Manufacturing Output as a Percent of GDP by Country (1980 to 2008) (2010)
- The 20 Most Valuable Companies in the World – November 2017*
- Warren Buffett’s 2016 Letter to Shareholders (2017)*
- Stock Market Capitalization by Country from 2000 to 2016 (2017)*
- Stock Market Capitalization by Country from 1990 to 2010 (2012)
- Monopolies and Oligopolies do not a Free Market Make (2008)
- Manufacturing Output by Country 1999-2011: China, USA, Japan, Germany (2013)
- Government Debt as Percentage of GDP 1990-2009: USA, Japan, Germany, China… (2010)
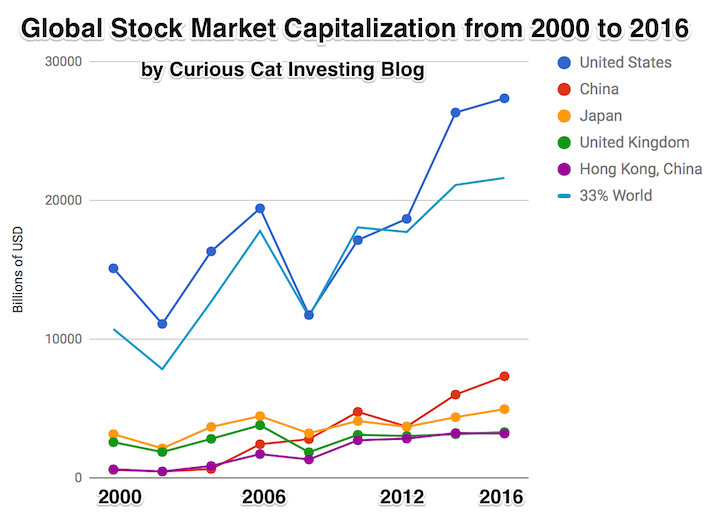
The chart shows the top countries based on stock market capitalization, with data from 2000 to 2016. The chart was created by Curious Cat Investing and Economics Blog may be used with attribution. Data from the World Bank.
This post lists the 20 publicly traded companies with the largest market capitalization as of today. Since my May 2017 list of the 20 most valuable stocks many of the market caps have increased significantly.
In the 20 most valuable companies list there are 13 USA companies, 4 Chinese companies and 1 each for Korea, Netherlands and Switzerland. The remaining 17 companies with market caps above $200 billion are based in: USA 8, China 5, Switzerland 2, Japan 1 and Taiwan 1.
| Company | Country | Market Capitalization | |
|---|---|---|---|
| 1 | Apple | USA | $898 billion |
| 2 | Alphabet (GOOGL) | USA | $729 billion |
| 3 | Microsoft | USA | $642 billion |
| 4 | Amazon | USA | $572 billion |
| 5 | USA | $531 billion | |
| 6 | Tencent | China | $506 billion* |
| 7 | Alibaba | China | $492 billion |
| 8 | Berkshire Hathaway | USA | $451 billion |
| 9 | Johnson & Johnson | USA | $371 billion |
| 10 | Exxon Mobil | USA | $345 billion |
Tencent (China) soared $192 billion (61%) since my May 2017 post (after a 85% gain shown in the last post – behind only Samsung for largest percentage gain in that post). That gain pushed Tencent over a $500 billion market cap and moved them from 10th most valuable to 6th. Alibaba also soared $192 billion (64% for them) and moved into the top 10.
Apple gained $73 billion in market cap and is closing in on a market cap over $1 trillion since my May 2017 post. Microsoft, which continues to gain value rapidly even though it is not getting the attention of many of the internet companies, increased by $117 billion. Amazon added $106 billion to their market cap in the last 6 months. Alphabet (Google) gained $77 billion while Facebook increased by $94 billion.
The next ten most valuable companies:
| Company | Country | Market Capitalization | |
|---|---|---|---|
| 11 | JPMorgan Chase | USA | $341 billion |
| 12 | Industrial & Commercial Bank of China (ICBC) | China | $319 billion* |
| 13 | Samsung | Korea | $310 billion |
| 14 | Walmart | USA | $289 billion |
| 15 | China Unicom | China | $281 billion |
| 16 | Bank of America | USA | $277 billion |
| 17 | Wells Fargo | USA | $267 billion |
| 18 | Nestle | Switzerland | $267 billion |
| 19 | Royal Dutch Shell | Netherlands | $260 billion |
| 20 | Visa | USA | $254 billion |
Market capitalization shown are of the close of business November 26th, as shown on Google Finance.
GE continued to collapse, dropping another 62 billion add dropping well out of the top 20 (they were one of the 10 most valuable companies in 2016).
The total value of the top 20 gained $1.2 trillion since my February, 2016 post: growing from $7.2 trillion to $8.4 trillion. Remember, the companies making up the top 20 has changed (China Unicom, Visa and Royal Dutch Shell were added while GE, China Mobile and Roche dropped out).
As I noted in Stock Market Capitalization by Country from 2000 to 2016: Apple, Alphabet, Microsoft, Facebook and Amazon have a combined market capitalization greater than the entire stock market in every country but those in the USA, China and Japan.
Related: Global Stock Market Capitalization from 2000 to 2012 – Stock Market Capitalization by Country from 1990 to 2010 – Historical Stock Returns
A few other companies of interest (based on their market capitalization):
The USA is currently looking to pass a tax bill. Actually the Republican party has decided to not seek bipartisan solutions so it is the Republicans that are looking to change the tax policy. They wish to call it tax reform but they are reforming nearly nothing. They are mainly moving around tax breaks to different people. The main aim seems to be to reduce taxes without reducing spending which given the huge annual deficit the USA government currently runs that means really this is a plan to shift taxes to the grandchildren of people living right now.
And within lowering taxes for some people today while placing those payments onto their grandchildren there is a bit of shifting around who will pay what now. Mostly this amounts to lowering the taxes on the rich today – along with some lowering of many people’s taxes that are in the middle class.
When you run a huge budget deficit (and have a huge amount of debt outstanding) “cutting taxes today” is just shifting taxes to the kids, grandkids and great-grandkids of those avoiding the taxes today. Truly cutting taxes (versus shifting them to a future generation) requires cutting the outstanding debt (which represents future tax increases) in addition to cutting current taxes.

The White House, Washington DC by John Hunter. See more of my photos of Washington DC.
To find reform ideas in the proposals requires using an extremely broad definition of what reform means. There are some attempts to reduce some favors in the tax code now for special interests. But these are minor compared to the goal of shifting the tax burden to grandchildren from those alive today.
One of the other goals is to reduce the corporate tax rate. This goal doesn’t look so great politically, so they are trying to minimize any focus on this. I think likely a reduction in the corporate tax rate is wise. This is mainly due, not to some principle that 25% corporate tax rate is better than a 35% rate (with all the system-wide effects that results in). Mainly a lower rate is needed when you consider the global economic system and the tax rates of other countries with an understanding of the global economy today. What must be sacrificed to reach a 20% corporate rate seems unreasonable to me, so 25% rate seems more sensible, but at this time they are trying to stretch to a 20% rate (and leave future generations to pay for the difference).
I support the effort to lower the corporate tax rate. In order to pay for that reducing some deductions is sensible. The plans have some of that and while each tax break has special interests benefiting from them I would support adding to the decreases in deductions. I would go along with a 20% rate if that was necessary, but think 25% or 22% or something would be better.
The most ludicrous part of the plan is the favors for trust fund babies. Eliminating the most capitalist friendly tax (the estate tax) and providing trust fund babies not only free inheritance without limit but stepping up the cost basis of investments is indefensible (economically indefensible, politically the Republicans obviously feel favors for trust fund babies are wise).
See my Curious Cat Tax Proposals blog post from 2016 for more of my ideas on how tax reform should be done.
The current deficit spending is made to look much less bad than it really is due to incredibly low interest rates. Given the inevitable rise in interest rates over the next 30 years the debt we pile on future generations is going to be much greater than it appears in an extremely low interest rate environment.
There are essentially 4 areas of significant federal spending.
- interest on the debt – this can’t be changed, it is set by the market
- spending on the department of defense (including spending on veterans)
- social security
- medicare and medicaid
There is no political will to reduce the costs of social security. I would raise the age at which you can begining taking payments and reduce payments to the rich. But this won’t pass, so that won’t change.
The Republicans have greatly increased spending by the department of defense so obviously this results in a tax increase (just on our descendants because they chose not to pay for the higher level of spending they voted for)