The article, What’s the Real U.S. Unemployment Rate? We Have No Idea, provides interesting information on the process for calculating the unemployment rate.
But it also misleads in saying “real US unemployment rate.”
As Dr. Deming said: “there is no true value” of any measured process. The results depend on the process which includes the operation definitions used.
Over time the value of a measure (as a proxy measure for some condition you care to monitor) can change.
It is important to update measures to avoid using proxies that lose value.
The unemployment rate certainly has proxy issues. But there is no “true unemployment rate.” There are ways to change the process to focus on different things (make the proxy better matched to certain issues). But also it seems to me, unemployment rate needs to have other related measures that are considered in concert with the unemployment rate (such as the labor force participation rate, perhaps some measure of under-employment etc.).
Those paying much attention do use other measures in concert but the last few years I read lots of different people complaining that the unemployment rate doesn’t capture various aspects of how the job market is poor (and often claiming the unemployment rate was “inaccurate” as though there was a platonic form of the actual rate divorced from the measure process.
Related: What Do Unemployment Stats Mean? – Economic Measurement Issues Arising from Globalization – Why China’s Economic Data is Questionable
Fed Continues Adding to Massive Quantitative Easing
In fact, while the Fed has pumped about $2.8 trillion into the financial system through nearly five years of asset buying.
Bank excess reserves deposited with the New York Fed have mushroomed from less than $2 billion before the financial crisis to $2.17 trillion today. In essence, roughly two-thirds of the money the Fed pumped into the banking system never left the building.
The Fed now pays banks for their deposits. These payment reduce the Fed’s profits (the Fed send profits to the treasury) by paying those profits to banks so they can lavish funds on extremely overpaid executives that when things go wrong explain that they really have no clue what their organization does. It seems very lame to transfer money from taxpayers to too-big-to-fail executives but that is what we are doing.
Quantitative easing is an extraordinary measure, made necessary to bailout the too-big-to-fail institutions and the economies they threatened to destroy if they were not bailed out. It is a huge transfer payment from society to banks. It also end up benefiting anyone taking out huge amounts of new loads at massively reduced rates. And it massively penalizes those with savings that are making loans (so retirees etc. planing on living on the income from their savings). It encourages massively speculation (with super cheap money) and is creating big speculative bubbles globally.
This massive intervention is a very bad policy. The bought and paid for executive and legislative branches that created, supported and continue to nurture the too-big-to-fail eco-system may have made the choice – ruin the economy for a decade (or who knows how long) or bail out those that caused the too-big-to-fail situation (though only massively bought and paid for executive branch could decline to prosecute those that committed such criminally economically catastrophic acts).
The government is saving tens of billions a year (maybe even hundred of billions) due to artificially low interest rates. To the extent the government is paying artificially low rates to foreign holders of debt the USA makes out very well. To the extent they are robbing retirees of market returns it is just a transfer from savers to debtors, the too-big-to-fail banks and the federal government. It is a very bad policy that should have been eliminated as soon as the too-big-to-fail caused threat to the economy was over. Or if it was obvious the bought and paid for leadership was just going to continue to nurture the too-big-to-fail structure in order to get more cash from the too-big-to-fail donors it should have been stopped as enabling critically damaging behavior.
It has created a wild west investing climate where those that create economic calamity type risks are likely to continue to be rewarded. And average investors have very challenging investing options to consider. I really think the best option for someone that has knowledge, risk tolerance and capital is to jump into the bubble created markets and try to build up cash reserves for the likely very bad future economic conditions. This is tricky, risky and not an option for most everyone. But those that can do it can get huge Fed created bubble returns that if there are smart and lucky enough to pull off the table at the right time can be used to survive the popping of the bubble.
Maybe I will be proved wrong but it seems they are leaning so far into bubble inflation policies that the only way to get competitive returns is to accept the bubble nature of the economic structure and attempt to ride that wave. It is risky but the supposedly “safe” options have been turned dangerous by too-big-to-fail accommodations.
Berkshire’s Munger Says ‘Venal’ Banks May Evade Needed Reform (2009)
Related: The Risks of Too Big to Fail Financial Institutions Have Only Gotten Worse – Is Adding More Banker and Politician Bailouts the Answer? – Anti-Market Policies from Our Talking Head and Political Class
Since I am living in Malaysia now, I pay attention to Malaysia’s economy. There are many reasons to be positive but the large consumer and government debt in Malaysia is a serious concern. They do have many administrators that say the right things, the question is going to be whether those statement define policy action or if they are ignored.
Wahid Says Ringgit Too Weak as Growth Improves: Southeast Asia
India and Indonesia have experienced large stock market declines and currency devaluations recently. The Malaysian Ringgit has declines 10% against the US $ in the last 3 months. Malaysia is holding up ok, but is venerable as these international loses of confidence often sweep over countries (and move from country to country).
There is a real risk that the current account could slip into a deficit for the first time since the fourth quarter of 1997, Macquarie Group Ltd. analysts said in a report this month.
“We are aware of this situation and we are aware of some of the measures to be undertaken to make sure that Malaysia remains in a surplus position,” Abdul Wahid said, without elaborating on the steps. “It is still a surplus and we are managing it.”
The surplus is narrowing on increased overseas investment and property buying, higher imports for infrastructure projects, lower palm oil and rubber export prices and the acquisition of new aircraft by Malaysian Airline System Bhd., the minister said.
The main foreign exchange earner recently seems to be selling property, that isn’t a good way to be earning foreign currency (selling assets). It is ok to do this to some extent, but relying on large inflows this way is very risky (and self defeating over the long term if it is too large). Even though palm oil and rubber exports are declining a bit, I believe they are still strong sources of foreign currency so that is good.
Medical “tourism” is a potentially huge market. The size of the market is greatly aided by the extremely expensive and broken USA health care system. Even while the standard rich country provides the same, or better, results than the USA for half the cost they are not doing well either (so the USA is very bad compared to pretty bad results for rich countries on average).
Medical tourism is on of the most attractive economic growth areas. However the competition is fairly high as the attractiveness of building such an industry is well known. Countries that have very good potential are: Thailand, Mexico, Malaysia, Singapore (for high end solutions), Costa Rica, India, Philippines and Panama. India has some great advantages but they have a deeply ingrained and extremely unhelpful bureaucracy. It seems to me that that creates a burden that likely means India can’t complete with the others effectively.
Even for the simplest aspect – visas for those seeking to bring income into the country as medical tourists I don’t have confidence India can do well.
Cayman to Singapore Gain as Rules Stump Clinics: Corporate India
“They’ve done everything to ruin our prospects of becoming a tourism center,” Reddy said. “I once said India should become the global health-care destination–now I’m swallowing those words. It could grow 10-fold in the next five years, if only the government would facilitate it, the way others have.”
India continues to be held back economically (across the entire economy not just in health care) by ineffective and burdensome regulation and government inefficiency.
The USA actually has a portion of the medical tourism market – those that have no concern about price (royalty, trust fund babies, movie stars etc.). Those with any concern about price can find the same level of care in Singapore, Japan, France, etc. at a fraction of the price.
I believe 2 or 3 countries in South East Asia will do very well with international medical care. The extent to which Thailand, Philippines, Singapore and Malaysia (and potentially others) do in this field could greatly impact their economic success. There is a great potential for Singapore and Malaysia to cooperate in this area (in Malaysia’s Iskandar region, which borders Singapore).
Related: Traveling To Avoid USA Health Care Costs –
Traveling for Health Care (2007) – Leading Countries for Economic Freedom: Hong Kong, Singapore, New Zealand…
Printing money (and the newer fancier ways to introduce liquidity/capital) work until people realize the money is worthless. Then you have massive stagflation that is nearly impossible to get out from under. The decision by the European and USA government to bail out the too big to fail institutions and do nothing substantial to address the problem leaves an enormous risk to the global economy unaddressed and hanging directly over our heads ready to fall at any time.
The massively too big to fail financial institutions that exist on massive leverage and massive government assistance are a new (last 15? years) danger make it more likely the currency losses value rapidly as the government uses its treasury to bail out their financial friends (this isn’t like normal payback of a few million or billion dollars these could easily cost countries like the USA trillions). How to evaluate this risk and create a portfolio to cope with the risks existing today is extremely challenging – I am not sure what the answer is.
Of the big currencies, when I evaluate the USA $ on its own I think it is a piece of junk and wouldn’t wan’t my financial future resting on it. When I look at the other large currencies (Yen, Yuan, Euro) I am not sure but I think the USD (and USA economy) may be the least bad.
In many ways I think some smaller countries are sounder but smaller countries can very quickly change – go from sitting pretty to very ugly financial situations. How they will wether a financial crisis where one of the big currencies losses trust (much much more than we have seen yet) I don’t know. Still I would ideally place a bit of my financial future scattered among various of these countries (Singapore, Australia, Malaysia, Thailand, Brazil [maybe]…).
Basically I don’t know where to find safety. I think large multinational companies that have extremely strong balance sheets and businesses that seem like they could survive financial chaos (a difficult judgement to make) may well make sense (Apple, Google, Amazon, Toyota, Intel{a bit of a stretch}, Berkshire Hathaway… companies with lots of cash, little debt, low fixed costs, good profit margins that should continue [even if sales go down and they make less they should make money – which many others won’t]). Some utilities would also probably work – even though they have large fixed costs normally. Basically companies that can survive very bad economic times – they might not get rich during them but shouldn’t really have any trouble surviving (they have much better balance sheets and prospects than many governments balance sheets it seems to me).
In many ways real estate in prime areas is good for this “type” of risk (currency devaluation and financial chaos) but the end game might be so chaotic it messes that up. Still I think prime real estate assets are a decent bet to whether the crisis better than other things. And if there isn’t any crisis should do well (so that is a nice bonus).
Basically I think the risks are real and potential damage is serious. Where to hide from the storm is a much tricker question to answer. When in that situation diversification is often wise. So diversification with a focus on investments that can survive very bad economic times for years is what I believe is wise.
Related: Investing in Stocks That Have Raised Dividends Consistently – Adding More Banker and Politician Bailouts in Not the Answer –
Failures in Regulating Financial Markets Leads to Predictable Consequences – Charlie Munger’s Thoughts on the Credit Crisis and Risk – The Misuse of Statistics and Mania in Financial Markets
Eurozone unemployment hits new high with quarter of under-25s jobless
The problem was most extreme in Greece where almost two-thirds of those under-25 are unemployed. The rate was 62.5% in February, the most recently available data.
…
Youth unemployment in Spain is 56.4%, in Portugal 42.5%. Italy recorded its highest overall unemployment rate since records began in 1977, at 12%, with youth joblessness at 40.5%. Economists said that the rise in unemployment was fairly broad-based with rises in so-called core countries as well, including Belgium and the Netherlands. The rate in France was 11%.
…
Ireland recorded one of the biggest falls in unemployment, down to 13.5% from 14.9% a year ago. That compares with a rate of 7.7% for the UK, where youth unemployment is 20.2%. The lowest rates for youth unemployment were in Germany at 7.5% and Austria at 8%.
Unemployment continues to be a huge problem. The slow recovery from the great recession caused by the too big to fail financial institutions continues to do great damage. That damage is very visible in unemployment figures and the huge transfer of wealth from savers to bail out otherwise failed financial institutions (that not only haven’t been made to be small enough to fail but continue to pay themseves enormous bonuses while taking the billions in transfer of wealth from retirees that have had their income sliced by the interest rate policies necessatated to bail out the bankers).
The USA employment situation is still bad but has actually could easily be much worse. Unemployment in the USA stands at 7.5% now (the rate for teenagers is 24.1%).
Related: 157,000 Jobs Added in January and Adjustments for the Prior Two Months add 127,000 More (Feb 2013) – USA Unemployment Rate Drops to 7.8%, 200,000 Jobs Added (Oct 2012) – USA Adds 216,00 Jobs in March and the Unemployment Rate Stands at 8.8% (March 2011)
USA health care spending continues to grow, consuming an ever increasing share of the economic production of the USA. USA health care spending is twice that of other rich countries for worse health care results.
- USA health care expenditures grew 3.9% to $2.7 trillion in 2011, or $8,680 per person, and accounted for 17.9% of Gross Domestic Product (GDP).
- Medicare spending grew 6.2% to $554.3 billion in 2011, to 21% of total health care spending.
- Medicaid spending grew 2.5% to $407.7 billion in 2011, or 15% of total health care spending.
- Private health insurance spending grew 3.8% to $896.3 billion in 2011, or 33 percent of total health care expenditures.
- Out of pocket spending grew 2.8% to $307.7 billion in 2011, or 11 percent of total health care spending.
- Hospital expenditures grew 4.3% to $850.6 billion in 2011.
- Physician and clinical services expenditures grew 4.3% to $541.4 billion in 2011.
- Prescription drug spending increased 2.9% to $263.0 billion in 2011.
- Per person personal health care spending for the 65 and older population was $14,797 in 2004, 5.6 times higher than spending per child ($2,650) and 3.3 times spending per working-age person ($4,511).
Individuals (28%) and the federal government (28%) accounted for the largest share of those paying for health care in the USA. Businesses pay 21% of the costs of health care while state and local governments pay 17%.
The United States Centers for Medicare & Medicaid Services (CMS) project that health care spending will rise to 19.6% of GDP by 2021. Since the long term failure of the USA health care system has resulted in costs increasing faster than inflation every year for decades, it seems reasonable to expect that trend to continue. The burden on the USA grows more and more harmful to the USA each year these rising costs continue.
In 2004, the elderly (65 years old and older) accounted for 12% of the population, and accounted for 34% of spending.
Data from US CMS (sadly the way they provide the data online my guess is this url will fail to work in a year, as they post the updated data – I don’t see a way to provide a link to a url with persistent data).
Half of the population spends little or nothing on health care, while 5% of the population spends almost half of the total amount (The High Concentration of U.S. Health Care Expenditures: Research in Action).
Related: USA Spends Record $2.5 Trillion, $8,086 per person 17.6% of GDP on Health Care in 2009 – USA Spent $2.2 Trillion, 16.2% of GDP, on Health Care in 2007 – USA Health Care Costs reach 15.3% of GDP – the highest percentage ever (2005) – Systemic Health Care Failure: Small Business Coverage
A recent report by Deloitte, The Hidden Costs of U.S. Health Care: Consumer Discretionary Health Care Spending provides some interesting data.
Between 2006 and 2010 USA health care expenditures increased by 19%. Government spending accounted for 40% of costs (remember that figure is lowered due to Deloitte’s including inputed value for care of relatives). Those 65 and older account for 61% of the inputed cost care that is provided.
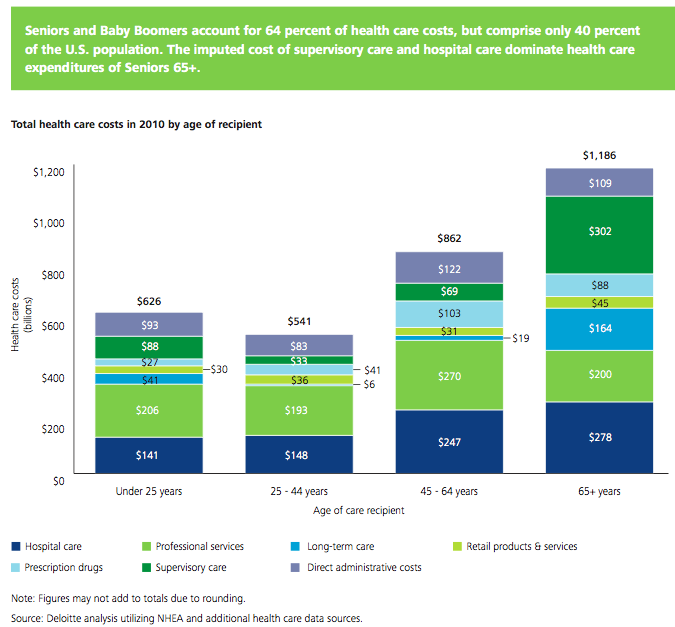
Seniors and baby boomers account for 64% of health care costs, but comprise only 40% of the USA population. The imputed cost of supervisory care and hospital care are far higher proportions of health care expenditures of seniors (65 and older).
I find this imputed value largely not worth considering. There are problems with the way we count GDP and economic activity (that affect health care and lots of other things). It is fine to be aware that they think $492 billion of extra care is given by family members but using that figure in any sensible way (other than saying hey there is a huge cost in people’s time to dealing with our health care system and sick people that isn’t counted in economic data) is questionable.
It is useful in looking at the increasingly old population we will see in the future and judging their is a large need for supervisory care that is not captured in just looking at the costs included in economic data currently. Not only will our grandkids have to pay for our living beyond our means today they will have to do so while providing unpaid care to their parents and grandparents.
The burden of long term supervisor care (that which can be provided by a non-health care professional) is one reason a resurgence in multi-generation housing options make sense to me. There are other good reasons also (child care, socialization, financial support to the young…). There are some real advantages and real disadvantages to such options. But I think economic advantages are going to encourage more of this going forward.
Related: Personal Finance Basics: Long-term Care Insurance – Health Care in the USA Cost 17.9% of GDP, $2.6 Trillion, $8,402 per person in 2010 – Resources for Improving Health Care System Performance
Total nonfarm payroll employment increased by 171,000 in October, and the unemployment rate increased at 7.9%, the U.S. Bureau of Labor Statistics reported today. Employment rose in professional and business services, health care, and retail trade. The change in total nonfarm payroll employment for August was revised from +142,000 to +192,000, and the change for September was revised from +114,000 to +148,000.
So with this report another 255,000 (171 + 50 + 34) were added, quite a good number. If we could see 250,000 jobs added for 12 more months that would be quite nice – though still will not have recovered all the jobs cost by the too-big-too-fail credit crisis.
Employment growth has averaged 157,000 per month thus far in 2012, about the same as the average monthly gain of 153,000 in 2011.
Hurricane Sandy had no discernable effect on the employment and unemployment data for October. Household survey data collection was completed before the storm, and establishment survey data collection rates were within normal ranges nationally and for the affected areas.
Long-term unemployment remains a problem, in October, the number of long-term unemployed (those jobless for 27 weeks or more) was little changed at 5.0 million. These individuals accounted for 40.6% of the unemployed (a higher percentage than normal – as it has been for the duration of the too-big-too-fail job recession.
The civilian labor force rose by 578,000 to 155.6 million in October, and the labor force participation rate edged up to 63.8%. Total employment rose by 410,000 over the month (I am guessing this is not seasonally adjusted – the highlighted figures normally quotes are seasonally adjusted figures). The employment-population ratio was essentially unchanged at 58.8%, following an increase of 40 basis points in September.
Related: Unemployment Rate Reached 10.2% (Oct 2009) – USA Economy Adds 151,000 Jobs in October and Revisions Add 110,000 More (Oct 2010, unemployment rate at 9.6%) – USA Unemployment Rate Drops to 8.6% (Nov 2011) – USA Lost Over 500,000 Jobs in November, 2008
The unemployment rate decreased to 7.8%, and total nonfarm payroll employment rose by 114,000 in September, the U.S. Bureau of Labor Statistics reported today. The change in total nonfarm payroll employment for July was revised from +141,000 to +181,000, and the change for August was revised from +96,000 to +142,000. Thus, with this report 200,000 new jobs were added (114,000 + 40,000 + 46,000).
The unemployment rate declined from 8.1% in August to 7.8% in September. For the first 8 months of the year, the rate held within a narrow range of 8.1 and 8.3%. The number of unemployed persons, at 12.1 million, decreased by 456,000 in September.
The number of long-term unemployed (those jobless for 27 weeks or more) was little changed at 4.8 million and accounted for 40.1% of the unemployed. This remains one of the most serious problems – along with the less that strong job creation numbers (since the too-big-too-fail financial crisis kicked off the great recession). In 2012, employment growth has averaged 146,000 per month, compared with an average monthly gain of 153,000 in 2011. 150,000 is decent but because of the huge job losses in the 4 years prior to 2011 there is a big recovery needed. Adding above 225,000 jobs a month, for years, would be a good result and put the economy on much firmer ground.
Health care added 44,000 jobs in September. Job gains continued in ambulatory health care services (+30,000) and hospitals (+8,000). Over the past year, employment in health care has risen by 295,000.
The average workweek for all employees on private nonfarm payrolls edged up by 0.1 hour to 34.5 hours in September. The manufacturing workweek edged up by 0.1 hour to 40.6 hours, and factory overtime was unchanged at 3.2 hours. The average workweek for production and nonsupervisory employees on private nonfarm payrolls was unchanged at 33.7 hours.
In September, average hourly earnings for all employees on private nonfarm payrolls rose by 7 cents to $23.58. Over the past 12 months, average hourly earnings have risen by 1.8 percent. In September, average hourly earnings of private-sector production and nonsupervisory employees increased by 5 cents to $19.81.
Related: Bad Jobs News in the USA, Unemployment Remains at 9.1% (Sep 2011) – USA Unemployment Rate at 9.6% (Sep 2010) – Unemployment Rate Increases to 9.7% (Sep 2009) – Over 500,000 Jobs Disappeared in November 2008