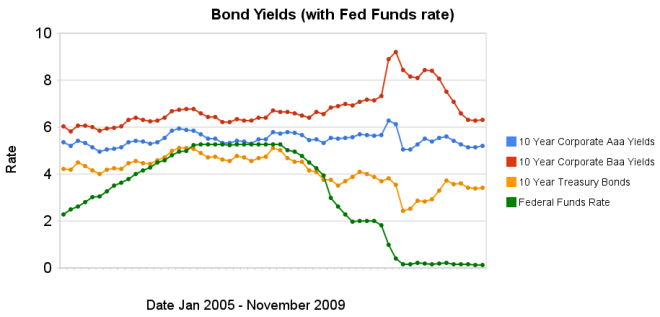
 Chart showing corporate and government bond yields from 2005-2009 by Curious Cat Investing Economics Blog, Creative Commons Attribution, data from the Federal Reserve.
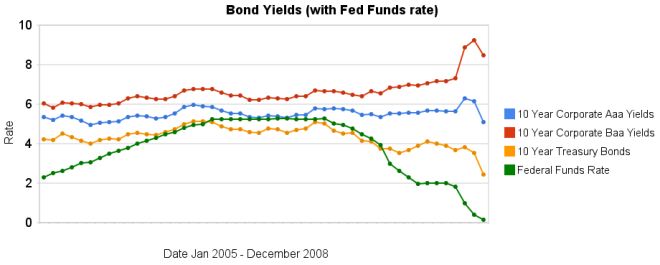
Bond yields have remained low, with little change over the last 4 months. Earlier in the year, yield spreads decreased dramatically, and those reductions have remained over the last 4 months. The federal funds rate remains under .25%.
Data from the federal reserve: corporate Aaa – corporate Baa – ten year treasury – fed funds
Related: Continued Large Spreads Between Corporate and Government Bond Yields (April 2009) – Chart Shows Wild Swings in Bond Yields (Jan 2009) – investing and economic charts
30 year fixed mortgage rates have declined a bit over the last few months and remain at very low levels.
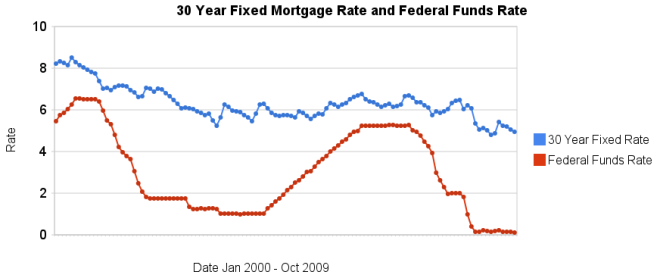
The poor economy, Unemployment Rate Reached 10.2%, has the Fed continuing massive intervention into the economy. The Fed is keeping the fed funds rate at close to 0% (.12% in October). They also continue to hold massive amounts of long term government and mortgage debt (in order to suppress interest rates on long term bonds – by reducing the supply of such bonds in the market).
I can’t see how lending US dollars, over the long term, at 5%, makes any sense. I would much rather borrow at those rates than lend. If you have not refinanced yet, doing so now may well make sense. And if you are looking at a new real estate purchase, financing a 30 year mortgage sure is attractive at rates close to 5%.
Related: historical comparison of 30 year fixed mortgage rates and the federal funds rate – Lowest 30 Year Fixed Mortgage Rates in 37 Years – Jumbo v. Regular Fixed Mortgage Rates: by Credit Score – What are mortgage definitions – Ignorance of Many Mortgage Holders
For more data, see graphs of the federal funds rate versus mortgage rates for 1980-1999. Source data: federal funds rates – 30 year mortgage rates
FDIC chief: Small banks can’t compete with bailed-out giants
” ‘Too big to fail’ has become worse,” Bair told USA TODAY. “It’s become explicit when it was implicit before. It creates competitive disparities between large and small institutions, because everybody knows small institutions can fail. So it’s more expensive for them to raise capital and secure funding.”
The left-leaning Center for Economic and Policy Research last month found that banks with more than $100 billion in assets paid 1.15% for funds, and all others paid 1.93% late last year and early this year. That amounted to an annual subsidy worth up to $34.1 billion for the 18 biggest bank companies.
Too big to fail is too big to exist. The actions to provide massive taxpayer bailouts to banks deemed too big to fail so that they could pay out billions in bonuses to those who failed so completely in managing their banks has been a continuing example of how bad an idea corporate welfare is. Not only are those given the huge bailouts just looting those payments for their friends much of the rest was just forwarded onto other big financial institutions (that had made bad bets in the unregulated financial markets they lobbied for) to have worthless financial instruments payoff with billions from taxpayer welfare payments to them.
If we allow the continual increase in anti-competitive behavior by financial institution to be encouraged by the politicians they provide with huge payments we are going to have much bigger problems than we have seen so far.
If you have accounts with these mega welfare financial institutions: close them. Move to some other institution that can support itself and does not abuse the taxpayers with support from “your” politician.
Related: Looting: Bankruptcy for Profit – Small Business Owners Angry at Big Banks – Canada’s Sound Regulation Resulted in a Sound Banking System Even During the Credit Crisis – More Outrageous Credit Card Fees
Mortgages Falling to 4% Become Bernanke Housing Focus by Brian Louis and Kathleen M. Howley
…
Conventional mortgages averaged 4.61 percent in 1951, 4 percent when backed by the Veterans Administration, and 4.25 percent by the Federal Housing Administration, according to The Postwar Residential Mortgage Market, a 1961 book written by Saul Klaman and published by Princeton University Press. Rates during the 1930s were as high as 7 percent.
…
Mortgages were cheaper through most of the 1940s, ranging from about 4 percent to 5.7 percent, depending on whether the lender was a life insurer, a commercial bank or a savings and loan. In that era, most loans were for 14 years and less.
…
The central bank has purchased more than $300 billion of mortgage-backed securities in 2009 through the week ended April 8, helping to cut home-loan rates to 4.82 percent last week from 5.1 percent at the start of the year, according to Freddie Mac data.
…
The difference between 30-year mortgage rates and 10-year Treasury yields has narrowed to about 2.2 percent from 3.1 percent in December, which was the widest since 1986. The spread remains almost 0.7 percentage point above the average of the past decade, data compiled by Bloomberg show. Rates for 15-year mortgages are about 1.8 percent above 10-year Treasury yields, compared with an average 1.4 percent since 1999.
Excellent article with interesting historical information. I don’t believe mortgage rates will fall to 4% but differences of opinion about the future is one function of markets. Those that predict correctly can make a profit. I am thinking of refinancing a mortgage and I think I am getting close to pulling the trigger. If I was confident they would keep falling I would wait. It just seems to me the huge increase in federal debt and huge outstanding consumer debt along with very low USA saving will not keep interest rates so low. However, as I have mentioned previously, it is interesting that the Fed is directly targeting mortgage rates and possible they can push them lower. The 10 year bond yield has been increasing lately so the slight fall in mortgage rates over the last month are due to the reduced spread (that I can see decreasing – the biggest question for me is how much that spread can decrease).
Related: Fed to Start Buying Treasury Bonds Today – Federal Reserve to Buy $1.2T in Bonds, Mortgage-Backed Securities – Low Mortgage Rates Not Available to Everyone – what do mortgage terms mean?
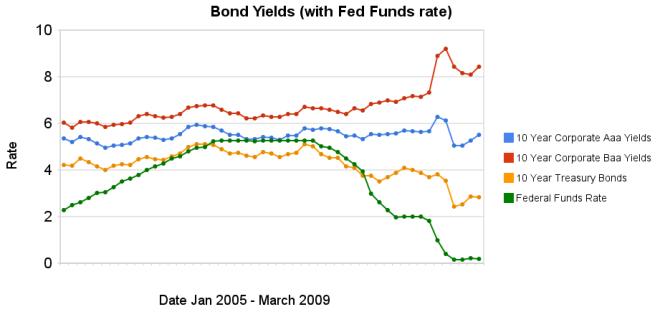 Chart showing corporate and government bond yields by Curious Cat Investing Economics Blog, Creative Commons Attribution, data from the Federal Reserve.
The federal funds rate remains under .25%. The large spread between government bonds and corporate bonds remains very large. In the last 3 months the yields on Aaa corporate bonds have increased 45 basis points, Baa corporate bond yields have decreased 1 basis points, while treasury bond yields have increased 40 basis points.
The spread between 10 year Aaa corporate bond yields and 10 year government bond yields is now 268 basis points. In January, 2008 the spread was 159 points. The larger the spread the more people demand in interest, to compensate for the increased risk. The spread between government bonds and Baa corporate bonds decreased to a still very large 566 basis points, the spread was 280 basis point in January 2008, and 362 basis points in September 2008.
Data from the federal reserve: corporate Aaa – corporate Baa – ten year treasury – fed funds
Related: Chart Shows Wild Swings in Bond Yields – Fed to Start Buying Treasury Bonds Today – Corporate and Government Bond Rates Graph (Oct 2008) – investing and economic charts
Fed to start buying T-bonds today, hoping to move rates
The yield on the 10-year T-note plunged to 2.53% on March 18 from 3% the previous day, the biggest one-day drop in decades. But since then, Treasury bond yields have been creeping higher. The 10-year T-note ended Tuesday at 2.65%. Conventional mortgage rates have flattened or inched up, although they remain historically low, in the range of 4.75% to 5%.
…
On Tuesday the Treasury sold $40 billion of new two-year T-notes at a yield of 0.95%, which was lower than expected, indicating healthy investor demand. The government will auction $34 billion in five-year notes today and $24 billion in seven-year notes on Thursday. Against numbers like those in just one week, the Fed’s commitment to buy $300 billion of Treasuries over six months doesn’t look like much.
…
there’s nothing to stop the Fed from suddenly announcing that its $300-billion commitment will get substantially bigger: The central bank can, in effect, print as much money as it wants to buy bonds — at least, until the day that global investors stop wanting dollars.
The original announcement caused a dramatic move but since then yields have been drifting up, every day, including today. Rates are already very low. And the huge amount of increased federal borrowing is a potential serious problem for lowering rates. And potentially an even more serious problem is foreign investors deciding the yield does not provide a good investment given the risks of inflation (I know that is how I feel). It will be interesting to see what happens with rates.
Related: Who Will Buy All the USA’s Debt? – Lowest 30 Year Fixed Mortgage Rates in 37 Years – mortgage terms
I make a point of showing the discount rate changes by the Fed don’t translate to mortgage rate changes. I do so because many people think the discount rate does directly effect mortgage rates. But the Fed announced today, actions that actually do impact mortgage rates.
Federal Reserve to Buy $1.2T in Bonds, Mortgage-Backed Securities
If you are looking at refinancing your mortgage now (or soon) might be a good time, rates were already very low and will be declining. And if you own long term bonds you just got a nice increase in your value (bond prices move up when interest rates move down).
Related: Lowest 30 Year Fixed Mortgage Rates in 37 Years – Low Mortgage Rates Not Available to Everyone – Why do we Have a Federal Reserve Board?
Dividends Falling Means S&P 500 Is Still Expensive
A total of 288 companies cut or suspended payouts last quarter, the most since Standard & Poor’s records began 54 years ago, when Dwight D. Eisenhower was president. While the S&P 500 is trading at the lowest price relative to earnings since 1985 and all 10 Wall Street strategists tracked by Bloomberg forecast a rally this year, predictions based on dividends show shares are overvalued by as much as 46 percent.
Just last November the S&P 500 dividend yield topped the bond yield for the first time since 1958. Yields often rise as stock prices fall on future prospects and companies announce dividend cuts after stocks have already fallen (due to the deteriorating conditions the company faces). So you always must be careful not to count dividends before they are paid. As an investor you need to look into the future and see how secure the dividends are likely to be.
Related: 10 Stocks for Income Investors – 10 Stocks for 10 Years – Curious Cat Investing Books
Since August of 2008 conforming mortgage rates are have declined a huge amount. Jumbo rates have fallen a large amount also, but much less (for example for a credit score of 700-759 the jumbo rates declined 73 basis points while the conventional rate declined 172 basis points.
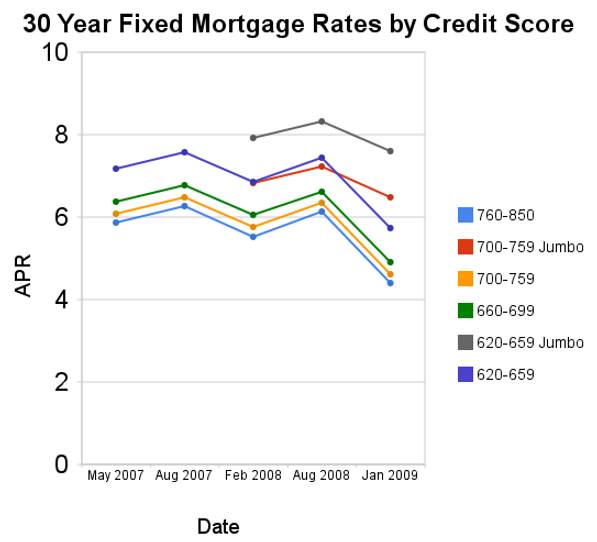
For scores above 620, the APRs above assume a mortgage with 1 point and 80% Loan-to-Value Ratio. For scores below 620, these APRs assume a mortgage with 0 points and 60 to 80% Loan-to-Value Ratio. You can see, with these conditions the rate difference between a credit score of 660 and 800 is not large (remember this is with 20% down-payment) and has not changed much (the difference between the rates if fairly consistent).
Related: Low Mortgage Rates Not Available to Everyone – 30 Year Fixed Rate Mortgage Rate Data – Real Free Credit Report (in USA) – Jumbo Mortgage Shoppers Get Little Relief From Rates – posts on mortgages
Read more
The recent reactions to the credit and financial crisis have been dramatic. The federal funds rate has been reduced to almost 0. The increase in the spread between government bonds and corporate bonds has been dramatic also. In the last 3 months the yields on Baa corporate bonds have increased significantly while treasury bond yields have decreased significantly. Aaa bond yields have decreased but not dramatically (57 basis points), well at least not compared to the other swings.
The spread between 10 year Aaa corporate bond yields and 10 year government bonds increased to 266 basis points. In January, 2008 the spread was 159 points. The larger the spread the more people demand in interest, to compensate for the increased risk. The spread between government bonds and Baa corporate bonds increased to 604 basis points, the spread was 280 basis point in January, and 362 basis points in September.
When looking for why mortgage rates have fallen so far recently look at the 10 year treasury bond rate (which has fallen 127 basis points in the last 3 months). The rate is far more closely correlated to mortgage rates than the federal funds rate is.
Data from the federal reserve – corporate Aaa – corporate Baa – ten year treasury – fed funds
Related: Corporate and Government Bond Rates Graph (Oct 2008) – Corporate and Government Bond Yields 2005-2008 (April 2008) – 30 Year Fixed Mortgage Rates versus the Fed Funds Rate – posts on interest rates – investing and economic charts