China continues to grow manufacturing is output. In 2009, the USA, and most countries saw declines in manufacturing production. China, however, continued to grow. China is now finally approaching the level of manufacturing done in USA. The latest data again shows the USA is the largest manufacturer but China looks poised to take over the number one spot soon.

The chart showing manufacturing output by country was created by the Curious Cat Economics Blog based on UN data (in 2009 USA dollars). You may use the chart with attribution.
The large decline in Germany was 23%. This was a 18% decline in Euro terms, and when you added the decline of the Euro the total USA dollar decline was 23%. Quite extraordinary. Most European countries were down over 15%. In fact, so extraordinary it makes me question the data. World economic data is useful and interesting but it isn’t perfect. USA manufacturing declined just .5%. China increased manufacturing production by 9%.
The last 2 years, China has stopped separating out mining and utilities from manufacturing. The percentage of manufacturing (to manufacturing, mining and utilities) was 78% for 2005-2007 (I used 78% of the manufacturing, mining and utilities figure provided in the 2008 and 2009 data – but that could be wrong). The unadjusted 2009 China total was $2.05 trillion and for the USA the total manufacturing, mining and utilities was $2.33 trillion. In 2009, the manufacturing total was 76% of USA manufacturing, mining and utilities. The percentage varies significantly between countries (the Russian federation is about 55% and Japan about 91%) and various over time as a countries economy changes.
The big, long term story remains the same. China has continued to grow manufacturing output tremendously. I see very little data to support the stories about manufacturing having to leave China to go elsewhere (especially when you look at the “lower wages” counties mentioned in news stories – they are not growing at any significant rate). The USA is still manufacturing a huge amount and that production has steadily grown over time.
When you look back over the period from 1980 to today you can see
- The biggest story is the growth in Chinese manufacturing
- The USA started out the largest and has grown significantly
- Japan did very well from 1980 to 1995, and since they have struggled
- The USA, China, Japan are really far ahead of other countries in total manufacturing output, and Germany is solidly in 4th place.
- After that the countries are fairly closely grouped together. Though there are significant trends hidden by the scale of this graph, which I will explore in future posts. South Korea has growth significantly over this period, for example.
- The biggest macro trend that the data shows, but is not so visible in this chart (other than China’s growth), is the very strong performance of emerging markets (and in fact some counties have fully become manufacturing powerhouses during this period, most notably China but also, South Korea and Brazil). And I see that continuing going forward (though that is speculation).
Two more interesting pieces of data. Italy is the 5th largest manufacturing country, I don’t think many people would guess that. Since 1980 Italy surpassed the UK and France but China rocketed passed them. And Indonesia has moved into 14th place, edging out Canada in 2009.
I plan to take more time in 2011 to look at global manufacturing and other global economic data more closely and to write about it here.
Related: Data on the Largest Manufacturing Countries in 2008 – Top 12 Manufacturing Countries in 2007 – Top 10 Manufacturing Countries 2006 – Leading global manufacturers in 2004
This webcast includes lots of interesting data on China’s economy (the SAIC green transportation concepts is also interesting but not as much as the economic data, to me). I knew China had overtaken the USA in purchases of new cars. I knew China continues to grow manufacturing output amazingly. I did not know how incredibly rapidly Chinese growth in manufacturing cars has been in the last couple of years.
In 2007 the USA produced 10.8 million cars and light trucks, Japan 11.6 million, China 8.9 million. In 2008 USA 8.7 million, Japan 11.6 million, China 9.3 million. In 2009 USA 5.7 million, Japan 7.9 million and China 13.8 million. That is an amazingly quick transformation. The credit crunch is obviously a big part of the issue but the bigger story is the growth on the broad Chinese consumer economy (most of those Chinese cars are being bought in China).
Another interesting country is India: In 2007 they produced 2.3 million, 2008 2.3 million and in 2009 2.6 million. Global production: 2007 – 73 million, 2008 – 70 million, 2009 – 62 million.
The webcast includes more interesting statistics. More than 250 million people have been removed from abject poverty (this is am amazingly great outcome that is often ignored). In 1978, .2% Chinese homes had a refrigerator; by 2008, 94% had refrigerators. In 2030 China will have 220 cities with over 1 million people. Today China has 110.
Related: Manufacturing Output as a Percent of GDP by Country – China Forecasts 9.6% GDP Growth, Close to Becoming 2nd Largest Economy (Dec 2009) – The Relative Economic Position of the USA is Likely to Decline
In previous posts I have shown data for global manufacturing output by country. One of the things those posts have showed is that manufacturing output in China is growing tremendously, but it is also growing in the United States. The chart below shows manufacturing production by country as a percent of GDP. China dominates again, with over 30% of the GDP from manufacturing.

Chart showing manufacturing output, as percent of GDP, by country was created by the Curious Cat Economics Blog based on UN data* (based on current USA dollars). You may use the chart with attribution.
For the 14 biggest manufacturing countries in 2008, the overall manufacturing GDP percentage was 23.7% of GDP in 1980 and dropped to 17% in 2008. I left India (15% in 1980, 15% in 2008), Mexico (20%, 18%), Canada (17%, 13%), Spain (25%, 14%) and Russia (21% in 1990 [it was part of USSR in 1980], 15%) off the chart.
Over the last few decades Korea, and to some extent China, are the only countries that have increased the percent of GDP from manufacturing. China has not only grown manufacturing activity tremendously but also other areas of the economy (construction, mining, information technology). The countries with the largest manufacturing portions of their economies in 2008 were: China 32%, South Korea 25%, Japan and Germany at 21%. The next highest is Mexico at 18% which declined slightly over the last 15 years (with NAFTA in place). Globally, while manufacturing has grown, other areas of economic activity have been growing faster than manufacturing.
The manufacturing share of the USA economy dropped from 21% in 1980 to 18% in 1990, 16% in 2000 and 13% in 2008. Still as previous posts show the USA manufacturing output has grown substantially: over 300% since 1980, and 175% since 1990. The proportion of manufacturing output by the USA (for the top 14 manufacturers) has declined from 31% in 1980, 28% in 1990, 32% in 2000 to 24% in 2008. The proportion of USA manufacturing has declined from 33% in 1980, 29% in 1990, 36% in 2000 to 30% in 2008. While manufacturing output has grown in the USA it has done so more slowly than the economy overall.
Related: The Relative Economic Position of the USA is Likely to Decline – Manufacturing Data, Accuracy Questions – Top 12 Manufacturing Countries in 2007 – Manufacturing Employment Data: 1979 to 2007 – USA Manufacturing Output Continues to Increase (over the long term)
* I made edits to the 1980 Brazil manufacturing data and 1980, 1985 and 2008 China manufacturing data because the UN data only showed manufacturing data combined with mining and utility data. And I am using older UN data that had manufacturing separated from mining and utility figures for China in the other years.
The Future of Manufacturing in the US and Europe, The German Marshall Fund. Speakers: Ron A. Bloom, Simon Fraser, Wilfried Porth and Philip Stephens. I must admit I didn’t find this to be the most useful webcast but for those interested it may be worth watching.
Related: Manufacturing Driving USA Recovery – USA Manufacturing Output Continues to Increase (over the long term) – Manufacturing Output in Historically by USA, Europe and Asia – Capacity Utilization Rate Up Slightly From All Time Low (Aug 2009)
Durables Orders, Home Sales Probably Rose: U.S. Economy Preview
Federal Reserve Bank of New York President William Dudley last week indicated policy makers are more concerned about maintaining growth than they are about immediate inflation threats.
…
Manufacturing, which accounts for 12 percent of the economy, expanded in January at the fastest pace since August 2004, according to the Institute for Supply Management’s factory index released Feb. 1.
…
Some manufacturers are also beginning to bring back workers or hire. Caterpillar, the world’s largest maker of bulldozers and excavators, is recalling about 100 laid-off technicians at an Indiana plant because of increased demand and may be hiring more, Bridget Young, a Caterpillar spokeswoman, said Feb. 18.
“Caterpillar may be recalling or hiring employees in business units at various facilities this year based on demand fluctuation,” Young said.
Factories added 11,000 workers to payrolls in January, the first increase in three years and the most since April 2006, the Labor Department said on Feb. 5. Overall, payrolls declined by 20,000, and the unemployment rate fell to 9.7 percent.
Obviously the economic disaster we had been poised to experience due to failed government action the last 10 years and excessive speculation by bankers and wall street has been averted in the short term. But the failure to take seriously the huge risks failed policies (bought by special interests from politicians) put our economy in leaves us at great risk for future problems. The ability to avert disaster so far has been very successful but the danders are still large. But right now the 2010 economy is looking much better than anyone could have hoped for a year ago when disaster seemed likely.
The problem is that now those politicians, that collected huge payments for the last 20 years for those they have provided huge benefits to (allowing them to carry out strategies that risk the economic well being of the country, bailing them out if the gamblers lose, allowing tens of billion of dollars is profits due to extremely low short term interest rates, that allow dishonest credit card practices, providing tax benefits to the rich that pay the politicians well…), are acting as though the disastrous practices of those they are in bed with are fine. They are setting us up to repeat the same thing again. Which is really not that big a surprise given the lack of character of those we chose to elect.
Manufacturing has been a strong part of why the economy has been so strong the last few decades. But the politicians has sought to allow those that pay them well to engage in practices that ruin the economy for the benefit of a few speculators.
Related: Global Manufacturing Employment Data from 1979 to 2007 – Corrupt Officials Have Fled China With As Much As $100 billion – Why Pay Taxes or be Honest – Estate Tax Repeal (another payoff to the rich paying politicians for favors)
Once again the USA was the leading country in manufacturing in 2008. And once again China grew their manufacturing output amazingly. In a change with recent trends Japan grew output significantly. Of course, the 2009 data is going to show the impact of a very severe worldwide recession.
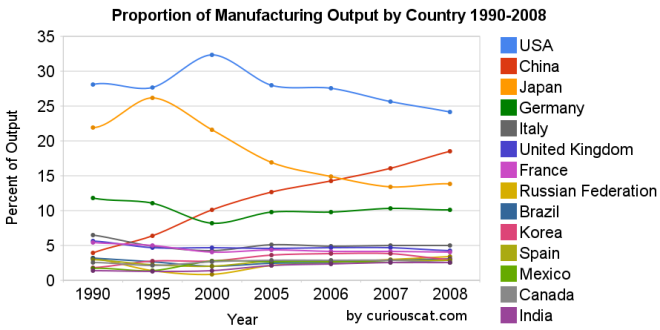 Chart showing the percentage output of top manufacturing countries from 1990-2008 by Curious Cat Management Blog, Creative Commons Attribution.
The first chart shows the USA’s share of the manufacturing output, of the countries that manufactured over $185 billion in 2008, at 28.1% in 1990, 27.7% in 1995, 32% in 2000, 28% in 2005, 28% in 2006, 26% in 2007 and 24% in 2008. China’s share has grown from 4% in 1990, 6% in 1995, 10% in 2000, 13% in 2005, 14% in 2006, 16% in 2007 to 18% in 2008. Japan’s share has fallen from 22% in 1990 to 14% in 2008. The USA has about 4.5% of the world population, China about 20%. See Curious Cat Investment blog post” Data on the Largest Manufacturing Countries in 2008.
Even with just this data, it is obvious the belief in a decades long steep decline in USA manufacturing is not in evidence. And, in fact the USA’s output has grown substantially over this period. It has just grown more slowly than that of China (as has every other country), and so while output in the USA has grown the percentage with China has shrunk. The percentage of manufacturing output by the USA (excluding output from China) was 29.3% in 1990 and 29.6% in 2008. The second chart shows manufacturing output over time.
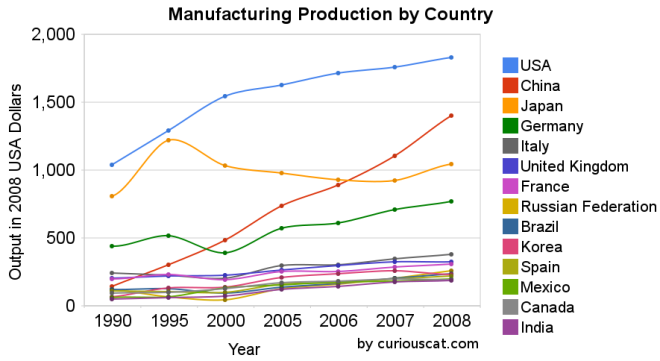 Chart showing the output of the top manufacturing countries from 1990-2008 by Curious Cat Management Blog, Creative Commons Attribution.
The 2008 China data is not provided for manufacturing alone (the latest UN Data, for global manufacturing, in billions of current USA dollars). The percentage of manufacturing (to manufacturing, mining and utilities) was 78% for 2005-2007 (I used 78% of the manufacturing, mining and utilities figure provided in the 2008 data). There is a good chance this overstates China manufacturing output in 2008 (due to very high commodity prices in 2008).
Hopefully these charts provide some evidence of what is really going on with global manufacturing and counteracts the hype, to some extent. Global economic data is not perfect. These figures are an attempt to capture the economic reality in the world but they are not a perfect proxy. This data is shown in 2008 USA dollars which is good in the sense that it shows all countries in the same light and we can compare the 1995 USA figure to 2005 without worrying about inflation. However foreign exchange fluctuations over time can show a country, for example, having a decline in manufacturing output in some year when in fact the output increased (just the decline against the USA dollar that year results in the data showing a decrease – which is accurate when measured in terms of USA dollars).
If the dollar declines substantially between when the 2008 data was calculated and the 2009 data is calculated that will give result in the data showing a substantial increase in those countries that had a currency strengthen against the USA dollar. At this time the Chinese Renminbi has not strengthened while most other currencies have – the Chinese government is retaining a peg to a specific exchange rate.
Korea (1.8% in 1990, 3% in 2008), Mexico (1.7% to 2.6%) and India (1.4% to 2.5%) were the only countries to increase their percentage of manufacturing output (other than China, of course, which grew from 3.9% to 18.5%).
Related: posts on manufacturing – Global Manufacturing Data by Country (2007) – Global Manufacturing Employment Data – 1979 to 2007 – Top 10 Manufacturing Countries 2006 – Top 10 Manufacturing Countries 2005
Manufacturing is an powerful driver of economic wealth. For years I have been providing data to counter the contention that the manufacturing base of the USA is gone and the little bit left was shrinking. The latest data again shows the USA is the largest manufacturer, and manufacturing in the USA continues to grow. It is true global manufacturing has begun to grow more rapidly than USA manufacturing in the last few years. I doubt many suspect that the USA’s share of manufacturing stayed stable from 1990 to 1995 then grew to 2000 took until 2006 to return to the 1990-1995 levels and then has declined in 2007 and 2008 a bit below the 1990 level and during that entire time was growing (even in 2007 and 2008).
The USA’s share of the manufacturing output, of the countries that manufactured over $185 billion in 2008, 28% in 1990, 28% in 1995, 32% in 2000, 28% in 2005, 28% in 2006, 26% in 2007 and 24% in 2008. China’s share has grown from 4% in 1990, 6% in 1995, 10% in 2000, 13% in 2005, 14% in 2006, 16% in 2007 to 18% in 2008. Japan’s share has fallen from 22% in 1990 to 14% in 2008 (after increasing to 26% in 1995 then steadily falling). The USA has about 4.5% of the world population, China about 20%.
Based on the latest UN Data, for global manufacturing, in billions of current US dollars:
| Country | 1990 | 1995 | 2000 | 2005 | 2006 | 2007 | 2008 |
|---|---|---|---|---|---|---|---|
| USA | 1,041 | 1,289 | 1,543 | 1,624 | 1,712 | 1,756 | 1,831 |
| China | 145 | 300 | 484 | 734* | 891* | 1,106* | 1,399** |
| Japan | 810 | 1,219 | 1,034 | 979 | 927 | 923 | 1,045 |
| Germany | 438 | 517 | 392 | 571 | 608 | 711 | 767 |
| Italy | 240 | 226 | 206 | 295 | 302 | 345 | 381 |
| United Kingdom | 206 | 218 | 226 | 264 | 295 | 323 | 323 |
| France | 200 | 233 | 190 | 255 | 255 | 287 | 306 |
| Russian Federation | 120 | 64 | 45 | 124 | 157 | 206 | 256 |
| Brazil | 120 | 125 | 96 | 137 | 163 | 201 | 237 |
| Korea | 66 | 131 | 136 | 211 | 234 | 260 | 231 |
| Spain | 112 | 104 | 98 | 160 | 170 | 196 | 222 |
| Mexico | 62 | 67 | 133 | 154 | 175 | 182 | 197 |
| Canada | 92 | 100 | 129 | 168 | 182 | 197 | 195 |
| India | 51 | 61 | 69 | 122 | 141 | 177 | 188 |
* I am using the data from last year that separated the manufacturing data (this year the data does not provide separate manufacturing data for China) instead of that shown in the most recent data (which doesn’t separate manufacturing)
** The China data is not provided for manufacturing alone. The percentage of manufacturing (to manufacturing, mining and utilities) was 78% for 2005-2007 (I used 78% of the manufacturing, mining and utilities figure provided in the 2008 data).
I hope to write a series of posts examining global manufacturing data including looking at manufacturing data specifically (excluding mining and utility data).
Read more
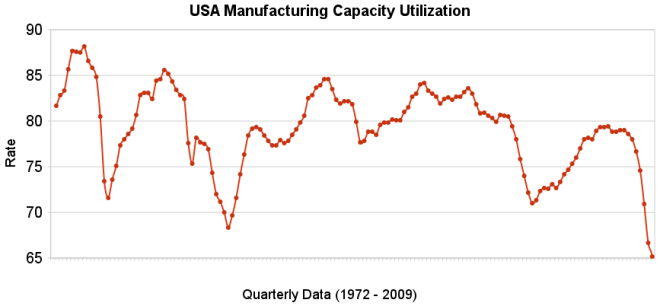 The chart shows the capacity utilization rate in the USA. By Curious Cat Investing Economics Blog, Creative Commons Attribution, data from the Federal Reserve.
Industrial production increased .5% in July and capacity utilization rate increased to 68.5% from an all time low of 68.1%. Capacity utilization has averaged 80.9% from 1972 to today.
Manufacturing output increased 1.0% in July but remained 14.4% lower than its year-earlier level. The factory operating rate rose to 65.4% in July, 70 basis points above the historical low recorded in June; the series begins in 1948. Production in durable goods industries advanced 2.2% in July. In addition to the sharp increase in motor vehicles and parts output, large production gains occurred for nonmetallic mineral products and for primary metals. The indexes for wood products, computer and electronic products, aerospace and miscellaneous transportation equipment, furniture and related products, and miscellaneous goods also rose. The indexes for fabricated metal products, machinery, and electrical equipment declined.
The production of nondurable goods fell 0.1% in July. The indexes for textile and product mills and for printing and support recorded sizable declines; the indexes for food, beverages, and tobacco and for petroleum and coal products also declined. The output of paper, of chemicals, and of plastic and rubber products increased.
The index for other manufacturing, which consists of publishing and logging, was down 0.6% in July.
The output of electric and gas utilities decreased 2.4%, and the operating rate for utilities dropped 21 basis points, to 77.6%. Mining production moved up 0.8%; its utilization rate in July, at 81.7%, was 59 basis points below its 1972-2008 average.
Data from the St. Louis Federal Reserve and Federal Reserve August 14th Industrial Production and Capacity Utilization press release.
Related: Loan Default Rates: 1998-2009 – Government Debt as a Percentage of GDP – USA Spent $2.2 Trillion, 16.2% of GDP, on Health Care in 2007
Read more
China Manufacturing Expands a Fourth Month
…
China’s economy may keep improving in the third and fourth quarters, enabling the nation to meet its 8 percent economic growth target for this year, central bank Governor Zhou Xiaochuan said this week.
Given the still quite uncertain global economy this is a pretty strong performance. And it is one of the positive indications that we may be recovering from the credit crisis. There continues to be fairly good news in many areas. However we are far from certain to make a decently global recovery even in 2010.
Related: Manufacturing Contracting Globally – Rodgers on the US and Chinese Economies – Manufacturing Cars in the USA – Leading Manufacturing Countries in 2007 – USA Unemployment Rate Jumps to 9.4% – The Economy is in Serious Trouble
The current economic climate is very bad and all car manufacturing in the USA has declined in the last 2 years. But the longer term trend is that foreign companies are manufacturing more and more here while the USA companies fail to. This year it is likely the “big three” will manufacture fewer than 50% of the cars manufactured in the USA (the “big three” have more production in Canada and Mexico than the “foreign” companies do).
They Can Build Them; Why Can’t We?
…
This transplant industry is replacing Detroit’s manufacturing. Through mid May, all North American assembly plants (including Canada and Mexico) have built 2.77 million cars and light trucks, half the production level of the year-earlier period. Of these, Detroit’s Big Three have built only 1.5 million of these vehicles, just 268,000 more than the transplants.
…
Toyota took over a badly managed GM plant in California; it was a joint venture, but the Japanese ran the plant. GM sent young executives to work there and learn Toyota’s manufacturing and quality techniques. They learned, but when they came back to GM, the GM bureaucracy would not change its ways.
Read about the joint Toyota – GM plant: Remembering NUMMI. The problems of GM, Ford and Chrysler are due mainly to long term failures or management. It is not impossible to manufacture in the USA. But it is difficult to maintain poor management systems, without overpaid executives when others manage better and don’t take so much of the profits into their own pockets.
Related: posts on manufacturing – Big Failed Three, Meet the Successful Eight – Leading Manufacturing Countries in 2007 – Honda has Never had Layoffs and has been Profitable Every Year – People: Team Members or Costs