Looking at stock market capitalization by country gives some insight into how countries, and stocks, are doing. Looking at the total market capitalization by country doesn’t equate to the stock holdings by individuals in a country or the value of companies doing work in a specific country. Some countries (UK and Hong Kong, for example) have more capitalization based there than would be indicated by the size of their economy.
It is important to keep in mind the data is in current USA dollars, so big swings in exchange rates can have a big impact (and can cause swings to be exacerbated when they move in tandem with stock market movements – if for example the market declines by 15% and the currency declines by 10% against the US dollar those factors combine to move the result down).

The chart shows the top four countries based on stock market capitalization, with data from 200 to 2012. The chart created by Curious Cat Investing and Economics Blog may be used with attribution. Data from the World Bank.
As with so much recent economic data China’s performance here is remarkable. China grew from 1.8% of world capitalization in 2000 to 6.9% in 2012. And Hong Kong’s data is reported separately, as it normally is with global data sets. Adding Hong Kong to China’s totals would give 3.7% in 2000 with growth to to 8.9% in 2012 (Hong Kong stayed very stable – 1.9% in 2000, 2% in 2012). China alone (without HK) is very slightly ahead of Japan.
The first chart shows the largest 4 market capitalizations (2012: USA $18.6 trillion, China and Japan at $3.7 trillion and UK at $3 trillion). Obviously the dominance of the USA in this metric is quite impressive the next 7 countries added together don’t quite reach the USA’s stock market capitalization. I also including the data showing the global stock market capitalization divided by 3 (I just divide it by three to have the chart be more usable – it lets us see the overall global fluctuations but doesn’t cram all the other data in the lower third of the chart).
Canada is the 5th country by market capitalization (shown on the next chart) with $2 trillion. From 2000 to 2012 China’s market capitalization increased by $3.1 trillion. The USA increased by $3.6 trillion from a much larger starting point. China increased by 536% while the USA was up 23.5%. The world stock market capitalization increased 65% from 2000 to 2012.
Related: Stock Market Capitalization by Country from 1990 to 2010 – Government Debt as Percent of GDP 1998-2010 – Manufacturing Output by Country 1999-2011: China, USA, Japan, Germany
USA, China, Japan and UK represented 47% of world stock market capitalization in 2000 and 55% in 2012. In the second chart I include countries with stock market capitalizations making them 5th through 12th in the rankings.
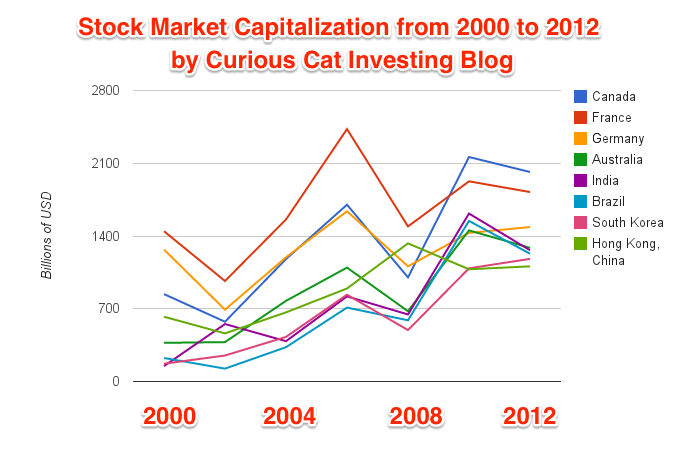
The chart shows the 5th through 12th countries based on stock market capitalization, with data from 200 to 2012. The chart created by Curious Cat Investing and Economics Blog may be used with attribution. Data from the World Bank.
This second group of countries accounted for 16% of global stock market value in 2000 and 21% in 2012. So they took 500 basis points of the 800 basis points the top 4 lost, meaning all the other countries picked up 300 basis points. India was the biggest gainer, up 753%, (though that has declined quite a bit this year) then South Korea up 590%, China was up 536%, Brazil up 444%, no other market over $1 trillion in value in 2012 was up over 250%.
As the chart shows this second grouping is pretty tightly packed together, with Canada ($2 trillion in 2012) and France ($1.8 trillion) with a bit of separation at the top. Germany had $1.5 trillion and the rest all were over $1.1 trillion.
Apple’s stock market capitalization soared over $600 billion in 2012 (Apple’s stock market capitalization today is $444 billion). Following Apple in stock market capitalization today are: Exxon is $384 billion, Google $295 billion, Berkshire Hathaway $284 billion, Microsoft $270, Industrial and Commercial Bank of China $256 billion, GE $248 billion, Walmart $247 billion, Chevron $241 billion, China Mobile $228 billion, Nestlé $222 billion.
The data is from the world bank and based on the listed domestic companies are the domestically incorporated companies listed on the country’s stock exchanges at the end of the year. I think that means that for example, Toyota stock (TM) is all counted in Japan (even though you can buy ADRs in the USA on the NYSE). And also Apple (AAPL) is all counted in the USA, even though both of those companies make a large portion of their money in other countries and produce much of there product in factories in other countries.
I would not be surprise to see a collection of the lower stock market capitalization countries increase in the next 20 years at rates higher than the largest (so countries like Brazil, South Africa, Thailand, Mexico, Malaysia, Ghana, Indonesia, Philippines…). I would be surprised if some of the smaller countries don’t do poorly but some will likely do fantastically well and over-shadow the poor performers (from a global investors perspective). I believe China will likely do very well (though being volatile).
The USA also has a chance to do very well – largely due to the international performance of many of the companies based there. I do expect to see a growing number of the top 100 market capitalization companies to be non-USA based companies over the next 20 years (mainly because the dominance the USA has there now is so large and many countries are doing smart things to drive successful businesses in their countries compared to 30 years ago). The USA did many good things, but probably more of the reason for the USA’s success if the bad policies elsewhere (as well as the post WW II position the USA was left in and the smart decision by the USA in the 1950s and 1960 to push science and engineering). Today many countries in Asia and Europe are better focused on the value of science and engineering than the leaders in the USA are. The USA is coasting on the huge science and engineering infrastructure built and nourished earlier.
Comments
5 Comments so far
Great data visualizations, thanks for sharing!
One thing that leaps out to me is how the US failed to regain it’s pre-2008 high, while so many of the other top countries reached, or surpassed, the high.
Does this indicate money leaving the US for these other “safer” or “more promising” markets?
1 Apple $626 billion
2 Exxon Mobil $405 billion
3 Microsoft $383 billion
4 Google $379 billion
Top ranks countries: USA, United Kingdom, Germany, France, Canada, Japan…
One thing for investors consulting historical data to remember is we may have had fundamental changes in stock valuations over the decades (and I suspect they have)…
[…] Global Stock Market Capitalization from 2000 to 2012 – Stock Market Capitalization by Country from 1990 to 2010 – Historical Stock […]