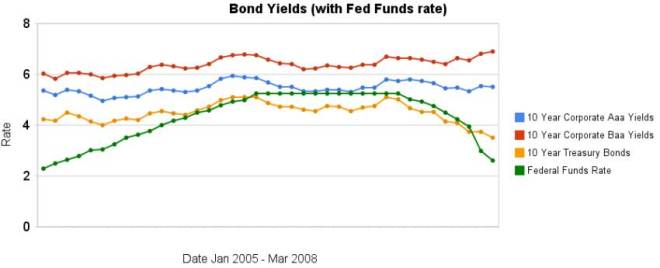
From January 2005 to July 2007 the Federal Funds Rate was steadily increased. The rate was held for a year. Since then the rate has been decreasing (dramatically, recently). As you can see from the chart, 10 year bond yields have been much less variable. The chart also shows 10 year corporate bond yields increasing in February and March when the federal funds rate fell well over 100 basis points.
Treasury bond yields are down but a huge part of the reason is a “flight to quality,” where investors are reluctant to hold other bonds (so they buy treasuries when they sell those bonds). Therefore other bond yields (and mortgage rates) are not decreasing. I guessed last month that the data “may well decrease some for both 10 year bonds once the March data is posted” which wasn’t the case. But I was right in “expect[ing] the spread between treasuries be larger than it was in January.”
Data from the federal reserve – corporate Aaa – corporate Baa – ten year treasury – fed funds
Related: 30 Year Fixed Mortgage Rates versus the Fed Funds Rate – After Tax Return on Municipal Bonds
Comments
2 Comments so far

This year, the average discount rate has fallen every month while the average 30 year mortgage rate has climbed all but 1 month (a 5 basis point drop)…
Over the last 2 months the yields on bonds have increased while the discount rate has continued to decline…