In some ways investing recently has been pretty easy, anything you have bought (almost) goes up – and usually goes up a lot. But when looking for bargains to invest in, it just keeps getting more and more difficult in my opinion.
Apple’s most recent earnings report was spectacular. However, unlike when similar things happened 8 years ago, when such great news allowed you to buy a great company cheaply even after great news now Apple went from an already pricy level and added 10% to that the next day. And it has continued to go up. Apple is by far my largest holding (given how expensive it is, a fairly crazy 25%). So I do still like the company long term, but I have been selling a bit the last year (though not nearly enough to keep it from dominating my portfolio more and more).
Years ago it was easy for me to buy Apple and be very confident I would do very well over the next 5 to 10 years. Now I am more hopeful than confident. And one reason why I continue to hold so much is I don’t see other great buys.
In the last 6 months I did make a big buy of Sea Limited ($SE) a company based in Singapore with large gaming, internet commerce and emoney interests. They are especially focused on South East Asia. I bought a lot of this quickly and that has proved wise (at least so far). I made it my 3rd largest holding (Alphabet is 2nd) very quickly and I am up over 100% already. It is speculative. But given my options it seemed like a great opportunity. I would have been much slower to increase the size of this position if I had other options I really liked.
Overall I am going much more into cash as a safe haven than I have before. Normally I am extremely overweight stocks. Even today I am still overweight stocks compared to the conventional wisdom (and the only bonds I hold are Series I USA Savings Bonds (which are actually a good investment option, though you are limited to buying $10,000 per year).
While the markets are giving investors great returns finding good buys is becoming more and more difficult (at least for me). For example, my 10 Stocks for 10 Years (2018 version) has done very well. But several of those stocks are much less a bargain today that they were. Apple is up from $225 to $450. Danaher from $103 to $206. Amazon from $2,000 to $3,150. Tencent from $43 to $68. Alibaba from $175 to $256. The only stock down is Abbvie, from $97 to $95 (though with dividends, it yields 5% now, it is up a small bit). Abbive seems like the rare bargain to me today. While there are short term risks Tencent and Alibaba also seem to be priced reasonably and offer good long term potential.
I think, my post, Long Term Changes in Underlying Stock Market Valuation, provides insight into the challenges of consistently finding the type of values today than was possible in previous decades.
Related: Investment Options Are Much Less Comforting Than Normal These Days (2013) – Retirement Portfolio Allocation for 2020 – Tucows: Building 3 Businesses With Strong Positive Cash Flow
The markets continue to provide difficult options to investors. In the typical market conditions of the last 50 years I think a sensible portfolio allocation was not that challenging to pick. I would choose a bit more in stocks than bonds than the commonly accepted strategy. And I would choose to put a bit more overseas and in real estate.
But if that wasn’t done and even something like 60% stocks and 40% bonds were chosen it would seem reasonable (or 60% stocks 25% bonds and 15% money market – I really prefer a substantial cushion in cash in retirement). Retirement planning is fairly complex and many adjustments are wise for an individual’s particular situation (so keep in mind this post is meant to discuss general conditions today and not suggest what is right for any specific person).
I wrote about Retirement Savings Allocation for 2010: 5% real estate, 35% global stocks, 5% money market, 55% USA stocks. This was when I was young and accumulating my retirement portfolio.
Today, investment conditions make investing in retirement more difficult than normal. With interest rates so low bonds provide little yield and have increased risk (due to how much long term bond prices would fall if interest rates rise, given how low interest rates are today). And with stocks so highly valued the likelihood of poor long term returns at these levels seems higher than normal.
So the 2 options for the simplest version of portfolio allocation are less attractive than usual, provide lower income than usual and have great risk of decline than usual. That isn’t a good situation.

View of Glacier National Park (a nice place to go in retirement, or before retirement) by John Hunter
I do think looking for dividend stocks to provide some current yield in this situation makes sense. And in so doing substitute them for a portion of the bond portfolio. This strategy isn’t without risk, but given the current markets I think it makes sense.
I have always thought including real estate as part of a portfolio was wise. It makes even more sense today. In the past Real Estate Investment Trusts (REITs) were very underrepresented in the S&P 500 index, in 2016 and 2017 quite a few REITs were added. This is useful to provide some investing in REITs for those who rely on the S&P 500 index funds for their stock investments. Still I would include REIT investments above and beyond their portion of the S&P 500 index. REITs also provide higher yields than most stocks and bonds today so they help provide current income.
While I am worried about the high valuations of stocks today I don’t see much option but to stay heavily invested in stocks. I generally am very overweight stocks in my portfolio allocation. I do think it makes sense to reduce how overweight in stocks my portfolio is (and how overweight I think is sensible in general).
Tencent is one of the stocks in my 10 stocks for 10 years portfolio. In fact it is my largest holding (when you consider that Tencent shares owned by Naspers. Some others have performed better since my reboot of the portfolio in August of 2018: Apple (from 225 to 318) and Danaher (from 103 to 162) and Naspers (33 to 34, which might not seem so great but 2 spinoffs provide another 15) but I still like Tencent a great deal for the next 8 to 10 years.
Tencent has quite a few huge global businesses. One of the most promising areas is Tencent Gaming. Tencent has ownership in many of the largest computer gaming companies globally.

image by Fredrick Tendong
Tencent’s ownership share in Gaming companies
- Tencent Games – Honor of Kings (Arena of Valor outside of China) and esports leagues
- Riot Games (100%) – League of Legends and esports leagues
- Supercell (84%) – Clash of Clans, Clash Royale, and Brawl Stars
- Epic Games (40%) – Fortnite and Unreal Engine (gaming engine used to create many games)
- Activision Blizzard (5%) – Call of Duty, World of Warcraft, StarCraft, Diablo, Hearthstone, Heroes of the Storm, Overwatch, Guitar Hero and Candy Crush. They are also involved with esports. (Activision Blizzard is a public company in the USA valued at $46 billion)
- Ubisoft (5%) – Assassin’s Creed, Far Cry, Just Dance and Prince of Persia. (public French company worth $8.7 billion)
- Grinding Gear Games (80%) – Path of Exile
- Glu Mobile (14%) – many smaller games (public USA company valued at $915 million)
- Bluehole (12%) – PlayerUnknown’s Battlegrounds
- Paradox Interactive (5%) – Stellaris, Europa Universalis, Hearts of Iron, Crusader Kings, Cities: Skylines (public Swedish company valued at $1.2 billion?)
- Funcom (29%) (public Norwegian company valued at $145 million – after the stock price increased last week due to a Tencent a buyout offer)
- Sumo Digital (10%)
Tencent also have an undisclosed majority stake in Miniclip. And they own large portions of Huya and Douyu, both are big players in streaming games (similar to Twitch and YouTube Gaming).
Tencent’s subsidiary, TiMi Studios, developed Activision’s Call of Duty: Mobile.
Tencent gaming revenue struggled in 2019 due to regulatory actions in China created problems for all game publishers there. Long term global gaming revenue should continue to grow quickly and Tencent stands to be one of the best positioned companies to profit from that trend.
Read more
This post is an exploration of a specific stock Tucows (TCX). Tucows, based in Canada, has built from their domain registration business into a company with 3 businesses poised for predictable cash flow generation.
In 2012 Tucows added Ting Mobile, a business that resells access to cell phone networks (Sprint, for CDMA, and T-mobile for GSM phones). This is not a flashy business but is a reliable cash flow generator.
In 2015 they added Ting Fiber, which builds fiber networks for small communities that have long been mistreated by incumbent Internet Service Providers (ISPs – such as Comcast and AT&T). This business requires a large up front investment but once it is operating provides a large and reliable cash flow.
Tucows has leveraged the cash flow from the domain registration business to build Ting business and now is leveraging the cash from both of those businesses to build the Ting Fiber business. I believe the Ting Fiber business is going to be a long term very profitable business.
Tucows’ commitment to customer service is a way they differentiate themselves from their competitors. They provide great customer service for the Ting service (I have been a customer for years specifically due to the good customer service).
Domain Services Business
OpenSRS and Enom are Tucows’ wholesale domain name providers.
This is a fairly boring business where the key is providing reliable service at a good price. It is not a high margin business, but one that consistently generates cash for Tucows.
If you look at the domain services business you will note that sales have decreased in 2018, this is due to Tucows a large customer (that had a very low margin deal with Tucows) that transferred away a 2.7 million domains. This seems to be a good business move but it does cause investors that don’t look closely to worry. They see a decline in revenue for their domain services businesses and worry about the long term prospects.
But investors that understand that this reflects a 1 time decrease in revenue may have the potential to pick up a bargain. The remainder of the business is expected to remain, and while it isn’t expected to grow much it should continue to provide cash to be invested elsewhere by Tucows.
Ting Mobile
Ting Mobile provides cell phone plans for as little at $10 a month. The charges are based off usage and are calculated based on the actual usage each month. For those that do not frequently use the data plans on their phones or have very high minutes of usage they are much cheaper than traditional plans. The average Ting Mobile subscriber bill is $23 (from Nov 2018 Tucows Investor presentation).
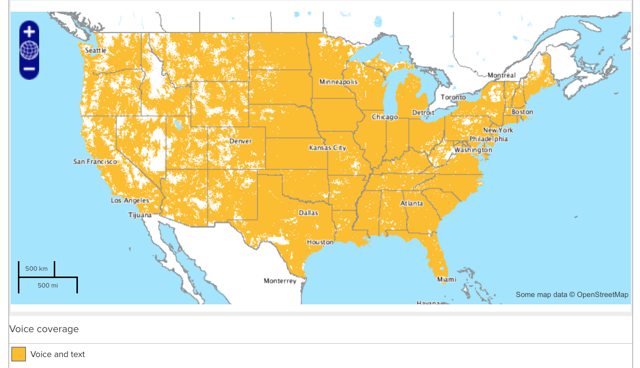
Ting coverage map
I don’t think they are competitive in prices for those that are heavy users of their smart phones. The image shows the phone call and text coverage map for CDMA devices on the Ting Mobile network.
So many companies market as though they care about customers yet they almost all treat customers very poorly. Ting is one the very few exceptions I have seen to that rule (Trader Joe’s is another).
This post lists the 20 publicly traded companies with the largest market capitalization as of today. Since my November 2017 list of the 20 most valuable stocks the value of 2 companies increased by more than $150 billion and 4 companies value decreased by over $100 billion.
In the 20 most valuable companies list there are 13 USA companies, 4 Chinese companies and 1 each for Korea, Netherlands and Switzerland. The remaining 15 companies with market caps above $200 billion are based in: USA 10, China 2, Switzerland 2 and Japan 1.
| Company | Country | Market Capitalization | |
|---|---|---|---|
| 1 | Amazon | USA | $802 billion |
| 2 | Microsoft | USA | $789 billion |
| 3 | Alphabet (GOOGL) | USA | $737 billion |
| 4 | Apple | USA | $720 billion |
| 5 | Berkshire Hathaway | USA | $482 billion |
| 6 | USA | $413 billion | |
| 7 | Tencent | China | $404 billion* |
| 8 | Alibaba | China | $392 billion |
| 9 | Johnson & Johnson | USA | $348 billion |
| 10 | China Unicom | China | $333 billion |
Amazon soared $220 billion since my November 2017 post and became the most valuable company in the world. Microsoft soared $147 billion and became the most valuable company in the world briefly before Amazon took the crown.
Apple lost $178 billion since my November 2017 post (after passing $1 trillion in market capitalization during 2018, up $100 billion from the November 2017 total, before declining). Facebook lost $118 billion off their market cap. Tencent lost $104 billion and Alibaba lost $100 billion in value during the same period.
Google increased 8 billion (since my November 2017 post).
The next ten most valuable companies:
| Company | Country | Market Capitalization | |
|---|---|---|---|
| 11 | JPMorgan Chase | USA | $332 billion |
| 12 | Visa | USA | $304 billion |
| 13 | Exxon Mobil | USA | $304 billion |
| 14 | Walmart | USA | $276 billion |
| 15 | Industrial & Commercial Bank of China (ICBC) | China | $270 billion* |
| 16 | Bank of America | USA | $255 billion |
| 17 | Nestle | Switzerland | $255 billion |
| 18 | Royal Dutch Shell | Netherlands | $250 billion |
| 19 | Pfizer | USA | $249 billion |
| 20 | Samsung | Korea | $240 billion |
Market capitalization shown are of the close of business November 26th, as shown on Google Finance.
Pfizer is the only new company in the top 20, growing by $37 billion to reach $249 billion and take the 19th spot (Wells Fargo dropped out of the top 20 and into 25th place).
Related: Global Stock Market Capitalization from 2000 to 2012 – Stock Market Capitalization by Country from 1990 to 2010 – Historical Stock Returns
Between $255 billion (which earns 15th place) and $223 billion there are 13 companies with market caps very close to each other.
A few other companies of interest (based on their market capitalization):
I created a 10 stocks for 10 years portfolio in April of 2005 which I shared on this blog. It did very well.
Over the years I adjusted the portfolio occasionally. Unfortunately the website I used to track results stopped doing that (and it is much more difficult to track results – with dividends, stock splits, spinoff… than you might suppose). I estimate I beat the S&P 500 by maybe 300 basis points annually (for the portfolio with slight adjustment over time, which is the one I tracked).
With this post I have created a new 10 stocks for 10 years portfolio.
The 10 stocks I came up with are (closing price on 22 April 2005 – % of portofilo invested):
- Tencent (TCEHY) – $43 and 15% (using the USA ADR). A phenomenal company with incredible global prospects for the long term. As the stock price has been hampered by concerns about China it has great potential for appreciation from the current price.
- Alibaba (BABA) – $175 and 15% (using USA ADR). Another phenomenal company with incredible global prospects that has performed poorly this year due to China concerns.
- Alphabet (GOOGL) – $1,254 and 11% (in the original 2005 portfolio the price was $216 and it started at 12% of the portfolio. The prospects are great long term, the stock price reflects that so it isn’t cheap but over the long term I expect it to do very well).
- Apple (AAPL) – $225 and 11% (I added Apple to the original 10 for 10 portfolio in 2010. The biggest mistake in the original portfolio was leaving off Apple, I considered it but chose not to include it. It has been my largest stock holding for years. It has been very cheap even just a few years ago, though today I think the price is much more reasonable so it isn’t the great bargin it has been. Still the long term prospects are great.)
- Abbvie (ABBV) – $97 and 10% (I added Abbive to the original portfolio in 2014. I would select a couple other healthcare stocks in a real invested portfolio for balance but Abbvie is the company I am most comfortable with so I include it here.)
- Toyota (TM) $125 and 9% (in the 2005 portfolio the price was $72 and it made up 12% of the portfolio). I believe the company is very well managed and the long term prospects are good though I am a bit worried about autonomous cars and the future of transportation. A potential new market for Toyota is robotics but they have not been as aggressive with software development innovation as I would hope on that front. The companies I am most interested in are very internet focused and I don’t like how concentrated that makes this portfolio so adding Toyota and Abbive adds a bit of diversity, though obviously not much)
- Amazon (AMZN) – $2,002 and 8% (in the 2005 portfolio the price was $33 a share, it was by far the best performer. It started as 8% of the original 2005 portfolio. I am very high on the prospects for the company, the stock price is what leads me to limit it to 8% of the new portfolio.)
- Naspers (NPSNY) – $33 and 8% (bought 30 October 2018, the company is largely a proxy for Tencent but also has many other significant investments in internet companies, the decline in Tencent, along with the Chinese market decline, and therefore the decline in Naspers just makes it too good an opportunity to pass up)
- Vanguard Health Care Index Fund (VHT) – $177 and 8% (I can’t decide on what other health care stock to hold for 10 years but I believe strongly in global growth of health care investments over the next 10 years so I settled on this low expense ETF.)
- Danaher (DHR) – $103 and 5% (I like this company but honestly the biggest reason for including it is to get some more diversity in the portfolio. I added it to the 2005 portfolio in 2008.)
I strongly believe that 10 years from now the Chinese stock market will have performed extremely well. There are of course numerous substantial worries about Chinese investments (the real estate bubble, high debt levels, “Great Firewall”, difficult government regulatory environment, restrictions on the press, restrictions on open debate…) but there are many reasons to be very optimistic about the long term prospects for China’s economic growth and the very promising leading companies prospects: such as Tencent, Alibaba, Baidu, Ctrip….
At this time it seems to me that the stock prices of leading Chinese companies are being held down compared to other leading companies (Apple, Google, Amazon…). Either the USA companies are overvalued or the Chinese ones are very under-valued or the global economy outside the USA is going to do very poorly in the next 10 years. Google, Apple etc. make a huge amount overseas but they have more earnings in the USA than Tencent and Alibaba (which still have almost none in the USA though their global business, outside China, is growing extremely rapidly).
One very big factor that I believe will support Chinese stock prices over the next 10 to 20 years is an large increase in the holdings of stocks by those in China. The current distribution of savings in China has extremely limited stock investments (and much larger bank savings accounts and real estate investments than in other countries). I expect that to change with a large increase in stock investing in China over the next 10 to 20 years.
Two other companies that are interesting are Naspers (which owns a huge amount of Tencent) and Softbank (which owns a large amount of Alibaba). Softbank has a large portfolio of investments in leading technology companies globally though much of it is held in a somewhat complicated manner. Naspers is more focused but also has a strong global portfolio. One of the very important aspects of Alibaba and Tencent is their huge portfolio of technology company investments made at the venture capital stage mostly (Google also has quite a few more investments than most people realize). I also believe Vanguard Emerging Market ETF (VWO) is a very good long term investment.
I wouldn’t be surprised if Chinese stocks had difficulty in the next year or two but long term stocks such as Alibaba and Tencent offer the best prospects considering realistic expectations for possible rewards compared to the risk investing in them poses today.
This portfolio is not meant to be a complete personal financial portfolio (at most it would be a portion of the portfolio allocated to equity holdings). Previous posts on portfolio allocation: Investment Risk Matters Most as Part of a Portfolio, Rather than in Isolation, Investment Options Are Much Less Comforting Than Normal These Days (2013) and Investing Return Guesses While Planning for Retirement.
Apple analysts are of no value to investors
If the stock moved more than 2% on any uptick in volume, I had to write a story explaining why. After dealing with that every day for about three years, I realized the overwhelming majority of analysts had no better clue than I did about what was moving Cisco’s stock.
Most investors know this, but if you don’t remember this lesson. The “explanations” you hear from media often are just as useless as horoscopes. A bunch of meaningless words presented in the hopes you don’t realize they are empty words.
The talking heads (and writers) need to say something. It would be much more useful if they took the time to do some research and put in some thought but they seem to be driven by the need to fill space instead of the need to inform.
It is also a huge waste of time, explaining random variation.
Related: Fooled by Randomness – Seeing Patterns Where None Exists – Illusions, Optical and Other – Understanding Data
This post lists the 20 publicly traded companies with the largest market capitalization as of today. Since my May 2017 list of the 20 most valuable stocks many of the market caps have increased significantly.
In the 20 most valuable companies list there are 13 USA companies, 4 Chinese companies and 1 each for Korea, Netherlands and Switzerland. The remaining 17 companies with market caps above $200 billion are based in: USA 8, China 5, Switzerland 2, Japan 1 and Taiwan 1.
| Company | Country | Market Capitalization | |
|---|---|---|---|
| 1 | Apple | USA | $898 billion |
| 2 | Alphabet (GOOGL) | USA | $729 billion |
| 3 | Microsoft | USA | $642 billion |
| 4 | Amazon | USA | $572 billion |
| 5 | USA | $531 billion | |
| 6 | Tencent | China | $506 billion* |
| 7 | Alibaba | China | $492 billion |
| 8 | Berkshire Hathaway | USA | $451 billion |
| 9 | Johnson & Johnson | USA | $371 billion |
| 10 | Exxon Mobil | USA | $345 billion |
Tencent (China) soared $192 billion (61%) since my May 2017 post (after a 85% gain shown in the last post – behind only Samsung for largest percentage gain in that post). That gain pushed Tencent over a $500 billion market cap and moved them from 10th most valuable to 6th. Alibaba also soared $192 billion (64% for them) and moved into the top 10.
Apple gained $73 billion in market cap and is closing in on a market cap over $1 trillion since my May 2017 post. Microsoft, which continues to gain value rapidly even though it is not getting the attention of many of the internet companies, increased by $117 billion. Amazon added $106 billion to their market cap in the last 6 months. Alphabet (Google) gained $77 billion while Facebook increased by $94 billion.
The next ten most valuable companies:
| Company | Country | Market Capitalization | |
|---|---|---|---|
| 11 | JPMorgan Chase | USA | $341 billion |
| 12 | Industrial & Commercial Bank of China (ICBC) | China | $319 billion* |
| 13 | Samsung | Korea | $310 billion |
| 14 | Walmart | USA | $289 billion |
| 15 | China Unicom | China | $281 billion |
| 16 | Bank of America | USA | $277 billion |
| 17 | Wells Fargo | USA | $267 billion |
| 18 | Nestle | Switzerland | $267 billion |
| 19 | Royal Dutch Shell | Netherlands | $260 billion |
| 20 | Visa | USA | $254 billion |
Market capitalization shown are of the close of business November 26th, as shown on Google Finance.
GE continued to collapse, dropping another 62 billion add dropping well out of the top 20 (they were one of the 10 most valuable companies in 2016).
The total value of the top 20 gained $1.2 trillion since my February, 2016 post: growing from $7.2 trillion to $8.4 trillion. Remember, the companies making up the top 20 has changed (China Unicom, Visa and Royal Dutch Shell were added while GE, China Mobile and Roche dropped out).
As I noted in Stock Market Capitalization by Country from 2000 to 2016: Apple, Alphabet, Microsoft, Facebook and Amazon have a combined market capitalization greater than the entire stock market in every country but those in the USA, China and Japan.
Related: Global Stock Market Capitalization from 2000 to 2012 – Stock Market Capitalization by Country from 1990 to 2010 – Historical Stock Returns
A few other companies of interest (based on their market capitalization):
The total stock market capitalization by country gives some insight but it is also data that is a bit muddy. The data doesn’t tell you how the economies of the countries are doing as there is quite a bit of room for misinterpreting the data.
Apple, Alphabet, Intel, 3M, Abbvie… all are included in the USA market capitalization but much of their sales, earnings and employment are overseas. And USA companies have done very well in global markets so the USA totals are not just an indication how the USA has performed but includes great gains made by profiting from global growth. Also you may be surprised to learn that 26% of USA equities are owned by investors outside the USA.
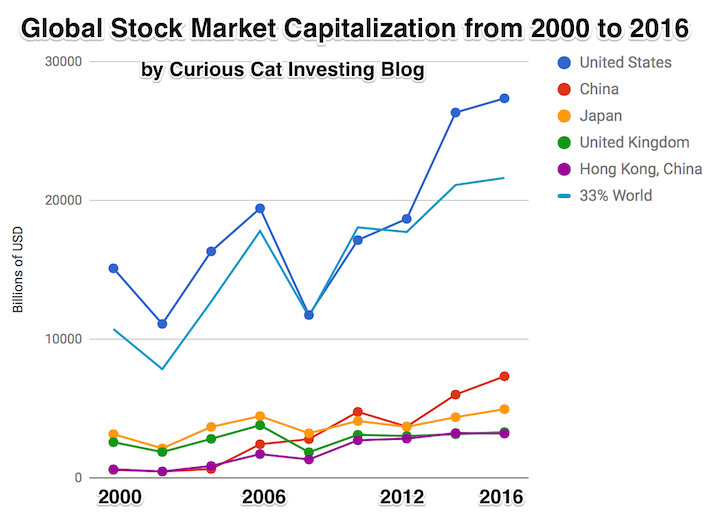
The chart shows the top countries based on stock market capitalization, with data from 2000 to 2016. The chart was created by Curious Cat Investing and Economics Blog may be used with attribution. Data from the World Bank.
It is important to keep in mind the data is shown in current USA dollars, so large swings in exchange rates can have a large impact.
China’s performance has been remarkable. China also shows some of the challenges in collecting this data. I am fairly certain Alibaba (BABA), one of the 10 most valuable companies in the world and a Chinese company has the stock issued in the USA (even this is confusing as it is a complex arrangement but the only publicly traded stock is traded in the USA). And many other Chinese companies are traded this way and therefore are not included in the Chinese total value. In addition Hong Kong is part of China but also separate. The data is reported separately by the world bank and I include them that way in the charts.
As with so much recent economic data China’s performance here is remarkable. China grew from 1.8% of world capitalization in 2000 to 6.9% in 2012 and 11.2% in 2016. Adding Hong Kong to China’s totals shows 3.7% in 2000 with growth to to 12.2% in 2012 and 16.2% in 2016. If you look at my post global stock market capitalization from 2000 to 2012 you will see significantly different historical data for Hong Kong. Collecting this data is much more complex than people realize and data determinations can change over the years resulting in changes in historical data.
The chart shows the 1/3 of the total global market capitalization in order to have the chart display look better (and it also makes it easier to compare the USA performance to the total global performance). The USA market capitalization was at 46.9% of the global market cap in 2000 and fell to 31.6% in 2000 before rising to 42% in 2016. This shows that the USA has largely held its own globally as measured by market cap. This may not seem impressive but when you consider that China has grown from 3.7% to 16.2% you can see that for the market cap outside of China the USA has actually gained quite a bit of ground. This is the result of what I mentioned before – how well USA companies have done at capture global markets (especially in high technology areas with very high profits and therefore very high market caps).
This post lists the 20 publicly traded companies with the largest market capitalization as of today. Since my February 2016 list of the 20 most valuable stocks many of the market caps have increased significantly.
| Company | Country | Market Capitalization | |
|---|---|---|---|
| 1 | Apple | USA | $825 billion |
| 2 | Alphabet (GOOGL) | USA | $652 billion |
| 3 | Microsoft | USA | $525 billion |
| 4 | Amazon | USA | $466 billion |
| 5 | USA | $437 billion | |
| 6 | Berkshire Hathaway | USA | $403 billion |
| 7 | Exxon Mobil | USA | $350 billion |
| 8 | Johnson & Johnson | USA | $334 billion |
| 9 | Samsung | Korea | $316 billion** |
| 10 | Tencent | China | $314 billion* |
Apple gained an amazing $284 billion in market cap since my February 2016 post. Only 12 companies (including Apple) are worth more than $284 billion. Amazon soared $204 billion (a 78% increase). Alphabet (Google) gained $156 billion in market cap.
Samsung soared $163 billion (a 107% gain) and Tencent soared $144 billion (a 85% gain) to move from outside the top 20 to become the 9th and 10th most valuable companies and the most valuable based outside the USA.
Facebook gained $126 billion and Microsoft gained $117 billion. GE lost $60 billion to drop out of the top ten. Wells Fargo also dropped out of the top 10.
The next ten most valuable companies:
| Company | Country | Market Capitalization | |
|---|---|---|---|
| 11 | JPMorgan Chase | USA | $308 billion |
| 12 | Alibaba | China | $298 billion |
| 13 | Wells Fargo | USA | $261 billion |
| 14 | Industrial & Commercial Bank of China | China | $258 billion* |
| 15 | Nestle | Switzerland | $253 billion |
| 16 | GE | USA | $240 billion |
| 17 | Bank of America | USA | $238 billion |
| 18 | Roche | Switzerland | $231 billion |
| 19 | Walmart | USA | $228 billion |
| 20 | China Mobile | China | $225 billion* |
Market capitalization shown are of the close of business May 12th, as shown on Google Finance.
In the 20 most valuable companies list there are 13 USA companies, 4 Chinese companies, 2 Swiss companies and 1 Korean company.
Alibaba (China) soared $131 billion (78%) and climbed to the 11th spot (from outside the top 20 last time). Bank of America soared $105 billion (up 79%).
Verizon was one of 2 companies in the top 20 to lose value in the period, Verizon declined $23 billion (over 10%) and dropped out of the top 20.
The total value of the top 20 gained $1.3 trillion since my February, 2016 post: growing from $5.9 trillion to $7.2 trillion. Remember, the companies making up the top 20 has changed.
Related: Global Stock Market Capitalization from 2000 to 2012 – Stock Market Capitalization by Country from 1990 to 2010 – Historical Stock Returns
A few other companies of interest (based on their market capitalization):
Read more