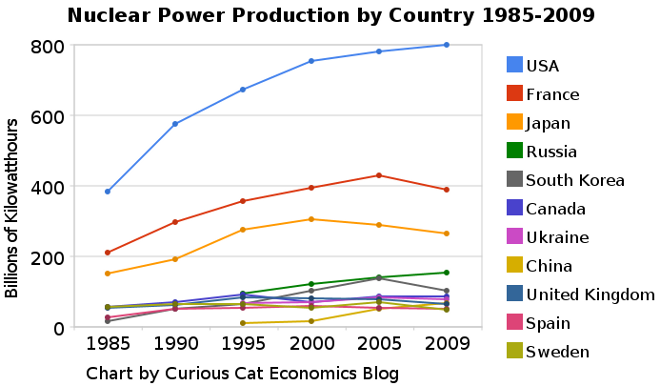
 The chart shows the leading nuclear power producing countries from 1985-2009. The chart created by Curious Cat Investing and Economics Blog may be used with attribution. Data from US Department of Energy.
___________________
Nuclear power provided 14% of the world’s electricity in 2009. Wind power capacity increased 170% Worldwide from 2005-2009, to a total of 2% of electricity used (38,025 Megawatts of capacity). The USA produced nearly twice as much electricity using nuclear power than any other country, which surprised me.
Another view of data on nuclear power shows which of the leading nuclear producing countries have the largest percentages of their electrical generating capacity provided by nuclear power plants (as of 2009). France has 75% of all electricity generated from nuclear power. Ukraine had the second largest percentage at 49%, then Sweden at 37% and South Korea at 35%. Japan is at 28% compared to 20% for the USA (I am surprised these are so close _ would have thought France and Japan would be much closer). Russia is at 18% and China was at just 2%. As of January 2011, 29 countries worldwide are operating 442 nuclear reactors for electricity generation and 65 new nuclear plants are under construction in 15 countries. Source, Nuclear Energy Institute.
From 1985 to 2009, USA production increased 108%, France 84% and Japan up 77%. South Korea is up 550% (from a very low starting point). Globally nuclear power production increased 80% from 1985 to 2009. From 2000-2009 production increased 5% in the USA and decreased by 1% in France and 13% in Japan. China was up 318% (from a very low level) from 2000-2009 (they did not have nuclear power capacity prior to 1995.
The global capacity of nuclear power was scheduled to increase more rapidly in the future before the earthquake in Japan and the crisis at the Kashiwazaki-Kariwa Nuclear Power Plant. China was going to add a great deal of capacity and is likely to over the next few years (nuclear power plants take many year to bring online so those coming online in the next few years have already had hundreds of millions invested in building them). Several European countries have already announced temporary closing of some plants (especially some plants nearing the end of their originally scheduled lives – which those countries had been in the process of extending).
As a comparison global oil production increased by 10.5% from 1999-2009, while nuclear global production increased by 5% from 2000-2009. From 1999-2009 USA oil production decreased 7%. Russia increased production 62% in the decade, moving it into first place ahead of Saudi Arabia that increased production 10%.
Related: Oil Production by Country 1999-2009 – Oil Consumption by Country 1990-2009 – Japan to Add Personal Solar Subsidies – Solar Thermal in Desert, to Beat Coal by 2020
Comments
3 Comments so far
From 1980 to 2010 the global consumption increased 38% to 87 million barrels a day. In the same period, USA consumption increased 12%. Meanwhile, Germany, Japan and France decreased petroleum use by 19%, 17% and 10% respectively.
[…] Nuclear Power Production by Country from 1985-2009 – Top Countries For Renewable Energy Capacity – Wind Power Capacity Up 170% Worldwide […]
I was surprised how poorly the USA has faired. It isn’t so surprising that we lagged. People forget how rich the USA was in 1970. The USA is still very rich but bunched together with lots of other rich countries instead of way out ahead as they were in 1970…