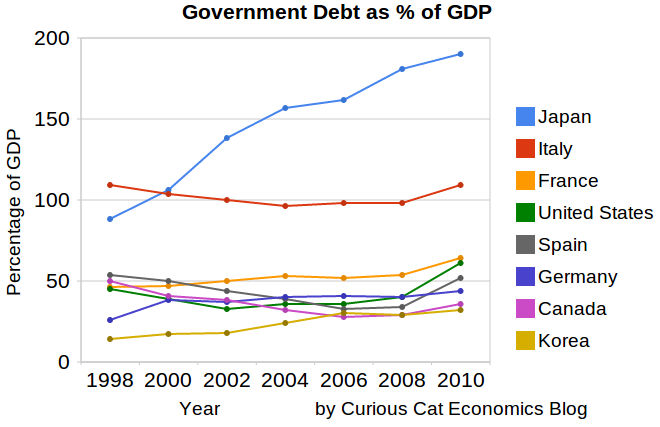
This chart shows government debt as a percent of GDP based on OECD data. The chart is limited to central government debt issuance and excludes therefore state and local government debt and social security funds.

Economic data is always a bit tricky to understand. It makes some sense that excluding social security would reduce the USA debt percentage a bit. But these debt as a percentage of GDP are lower than other sources show. There are obviously many tricks that can be used to hide debt and my guess is the main thing going on with this data is OECD intentionally trying to make things look as good as possible.
Still looking at historical trends in data is useful. And I believe looking at data from various sources is wise. There has been a dramatic increase from 2008-2010. The USA is up from 41% of GDP to 61%. Spain is up from 34% to 52% (but given all the concern with Spain this doesn’t seem to indicate the real debt problems they have.
Japan and France don’t have 2010 data, so I used a rough estimate of my own based on 2009 data. Greece has been over 100% since 1998 and now stands at 148%, 2nd worst (to Japan) for any OECD country (Europe, North America, Japan and Korea), Italy is 3rd. Ireland is at 61% (up from 28% in 2008). The UK is at 86%, up from 61%.
Related: Government Debt as Percentage of GDP 1990-2009: USA, Japan, Germany, China… (based on IMF data) – Government Debt as Percentage of GDP 1990-2008 – Government Debt Compared to GDP 1990-2007 – Top 15 Manufacturing Countries in 2009
Comments
5 Comments so far
[…] today is extremely uncertain. The whole eurozone financial situation is very questionable. The government debt burden in the USA and Japan is far too high (and of course Europe). China is still far from being a strong economy (they are huge, fast growing […]
One of the biggest risks to the Malaysian economy is increasing budget debt. The total debt is over 50% of GDP now, which is actually an acceptable figure (if annual deficits are small). But the annually deficient is extremely unsustainable at over 5% of GDP the last few years…
The annual Economic Freedom of the World report uses 42 distinct variables to create an index ranking countries around the world based on policies that encourage economic freedom. The cornerstones of economic freedom are personal choice, voluntary exchange, freedom to compete, and security of private property…
The dominance of the USA in stock market capitalization is quite impressive – the next 7 countries added together don’t quite reach the USA’s stock market capitalization.
[…] Government Debt as Percent of GDP 1998-2010 for OECD – Gross Government Debt as Percentage of GDP 1990-2009: USA, Japan, Germany, China – […]