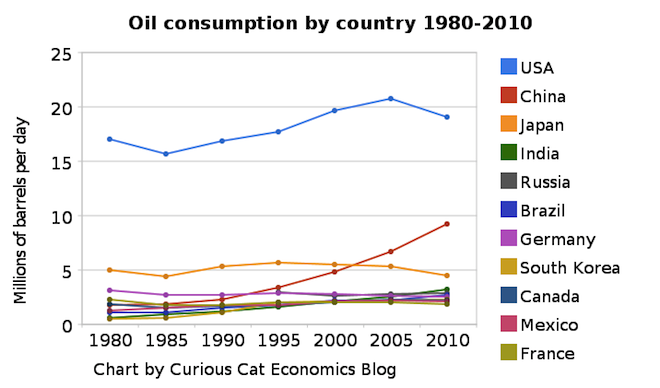
Chart of petroleum consumption by country 1980-2010 by the Curious Cat Investing and Economics Blog. The chart may be used with attribution.
The USA remains, by a huge margin, the largest consumer of petroleum products (motor gasoline, jet fuel, liquefied petroleum gases, residential fuel oil…) using 22% of the total (with about 4.5% of the population). From 1980 to 2010 the global consumption increased 38% to 87 million barrels a day.
From 1980 to 2010 USA consumption increased 12% (so less than global consumption). Meanwhile, Germany, Japan and France decreased petroleum use by 19%, 17% and 10% respectively. Many countries have very low use in 1980 and have grown their economies dramatically over this period and increased petroleum use dramatically also: India up 433%, China up 411%, South Korea up 360%.
Africa, in total, used 3.3 million barrels a day in 2010, up 120% from 1980. Africa used 73% of what Japan used in 2010 and 17% of what the USA used and 50% more than Canada. The data shows no sign of declining petroleum consumption on a global basis. The USA uses as much as China, India, Brazil and Africa combined. I believe, in 2015 those countries (by which I mean all the countries in Africa too, not that Africa is a country, which of course it is not) will use more than the USA (and likely show significant growth from 2010 levels).
Data is from the US Energy Information Agency.
Related: Oil Production by Country 1999-2009 – Top Countries For Renewable Energy Capacity – Chart of Nuclear Power Production by Country from 1985-2009 – Increasing USA Foreign Oil Dependence In The Last 40 years
Comments
4 Comments so far
[…] ebook @ MoneySmartsBlog -What to do after registering for the CFA exam @ SmartFinancialAnalyst -Oil Consumption by Country @ Curious Cat -How has buy and hold survived for so long? @ Hope to Prosper -Living the moment @ […]
It looks like the future movement will depend as much on the developing world as it will on the US economy.
GDP growth rates per capita: Korea – 1,430 %; China – 1,217 %; Singapore – 901 %; Indonesia – 543 %; Brazil – 453 %
[…] Chart of Largest Petroleum Consuming Countries from 1980 to 2010 (2011) […]