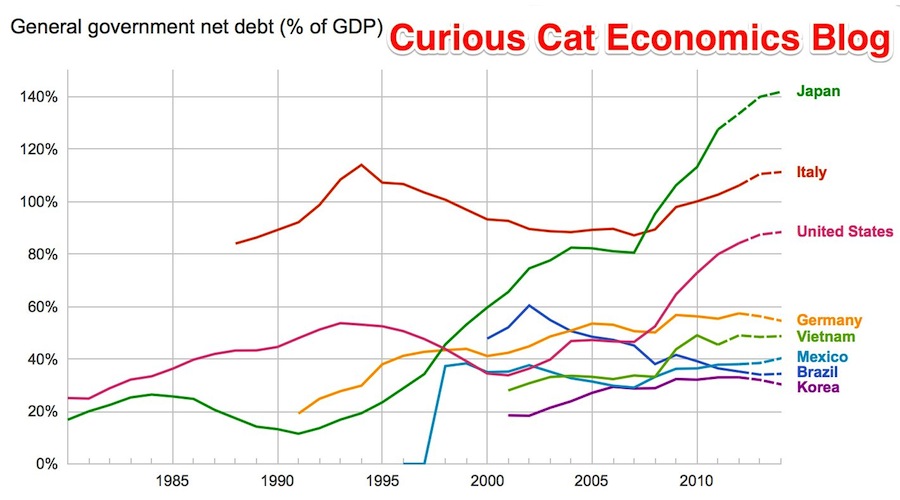
The data, from IMF, does not include China or India.
The chart shows data for net debt (gross debt reduced by certain assets: gold, currency deposits, debt securities etc.).
Bloomberg converted [broken link was removed] the data to look at debt load per person (looking at gross debt – estimated for 2014). Japan has ill-fortune to lead in this statistic with $99,725 in debt per person (242% of GDP), Ireland is in second with $60, 356 (121% of GDP). USA 3rd $58,604 (107%). Singapore 4th $56,980 (106%). Italy 6th $46,757 (133%). UK 9th $38,939 (95%). Greece 12th $38,444 (174%). Germany 14th $35,881 (78%). Malaysia 32nd $6,106 (57%). China 48th $1,489 (21%). India 53rd $946 (68%). Indonesia 54th $919 (27%).
I think the gross debt numbers can be more misleading than net debt figures. I believe Singapore has very large assets so that the “net” debt is very small (or non-existent). Japan is 242% in gross debt to GDP but 142% of net debt (which is still huge but obviously much lower). The USA in contrast has gross debt at 107% with a net debt of 88%.
Related: Government Debt as Percent of GDP 1998-2010 for OECD – Gross Government Debt as Percentage of GDP 1990-2009: USA, Japan, Germany, China – Chart of Largest Petroleum Consuming Countries from 1980 to 2010 – Top Countries For Renewable Energy Capacity
Comments
1 Comment so far

[…] Japan has a much bigger debt problem than the USA in percentage terms. Nearly all their debt is owed to those in Japan so when it is paid it merely redistributes wealth (rather than losing it to those overseas). It is much better to redistribute wealth within your country than lose it to others (you can always change the laws to redistribute it again, if needed, as long as it is within your economy). […]