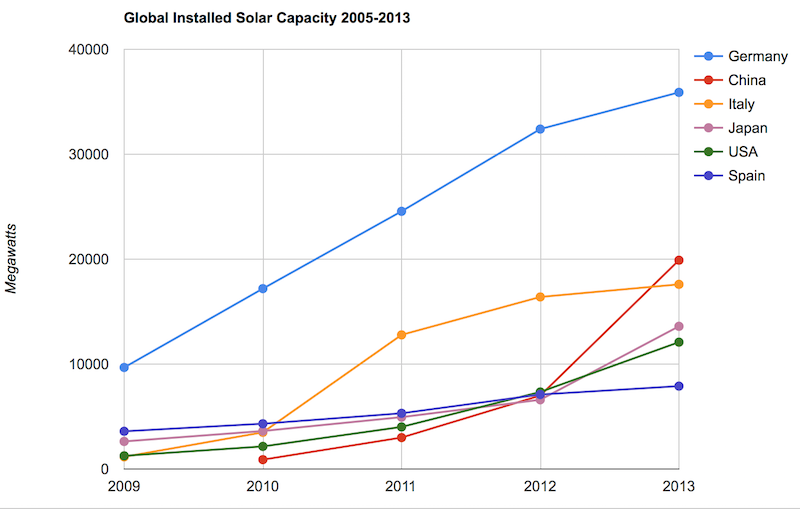
Solar energy capacity has been growing amazingly quickly the last few years. Part of the reason for this is the starting point was so low, making it easy to have large gains.

Chart by Curious Cat Economics Blog using data from the US Department of Energy. Chart may be used with attribution as specified here.
As with so many macro economic measures China has made enormous investments in solar energy the last few years. China’s increase in 2013 was larger than the USA’s total capacity at the end of 2013. Since solar energy use on a large scale is still small investments are quickly ramping up. Europe was a few years ahead of others putting countries like Germany, Spain and Italy far in the lead. China, the USA and Japan have been investing huge amounts the last few years and will likely leave those other than Germany (which already has such a large capacity) far behind very shortly.
In the USA, even after growing 60% in 2008, 53% in 2009, 71% in 2010, 86% in 2011, 83% in 2012 and 64% in 2013 solar energy capacity only totaled 1% of USA total electrical capacity. In 2013 hydropower was 6.8%, wind was 5.3% and biomass was 1.3%. The increase in solar capacity should continue to grow rapidly and is starting to make significant contributions to the macroeconomic energy picture.
When you look at total electricity generation solar only represented .5% (compared to 6.6% for hydropower 4.1% for wind and 1.5% for biomass).
USA data based on only solar capacity that is connected to the grid (and my guess would be that is the measure used in other countries too). Data is largely from that Department of energy report, with historical data for other countries pulled from previous editions.
The US Energy Information Agency (USEIA) expects the USA to add (net) 9,841 MW of wind capacity; 4,318 MW of natural gas capacity and 2,235 MW of solar in 2015. In 2015 they also predict a net decline of 12,922 MW of coal capacity. They also share that nuclear plants and natural gas combined-cycle generators having utilization factors 3 to 5 times those of wind and solar generators, which means capacity measures are significantly different from actually produced electricity measures.
The USEIA has predicted “global solar PV capacity seen rising from 98 GW in 2012 to 308 GW in 2018.” They predicted in 2018 China would have the most solar PV capacity followed by Germany, Japan and the USA.
The Solar Energy Industries Association (USA) states that 5,000 MW of solar capacity was added in the USA in 2013 and 7,000 MW in 2014. They forecast 8,000 MW to be added in 2015 and 12,000 MW in 2016.
Related: Solar Direct Investing Bonds – Chart of Global Wind Energy Capacity by Country 2005 to 2013 – Leasing or Purchasing a Solar Energy System For Your House – Nuclear Power Generation by Country from 1985-2010 – Google Invests $168 million in Largest Solar Tower Power Project (2011) – Molten Salt Solar Reactor Approved by California (2010) – 15 Photovoltaics Solar Power Innovations (2008)
Comments
1 Comment so far
[…] from IAE report for total installed photovoltaic (PV) solar capacity. See previous post on chart of Solar Energy Capacity by Country from 2009 to 2013. Different data sources for different year (and/or countries in the same year) is not ideal but for […]