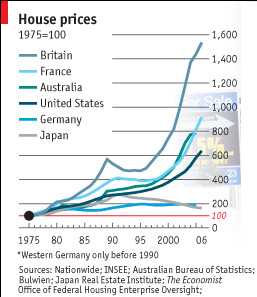
From 1975 to 2006 house prices in the UK increased 14 times. At 14 times that works out to about a 9% annual rate of return which is doesn’t sound nearly as impressive as a 14 fold increase to most people (I believe). The article does not mention if the chart is adjusted for inflation (a 9% return after inflation is incredibly good, a 9% return before factoring in inflation – which would reduce the rate of return – is good but reasonable) – my guess is that the chart is adjusted for inflation (meaning Britain’s owning real estate have been fortunate). Online calculator for annual rates of return over time.
Real estate rate of returns (when calculated on the total price) also underestimate the “real return” most investors experience because investors often only put down a portion of the investment. So the real rate of return is increased dramatically to the investor as a result of the the multiplier effect of buying on margin. Of course, real estate also has expense related to upkeep and the advantage of providing a place to live…
The graph (from the economist – see: Through the roof) shows other countries, USA: about 6 times, France 9 times… Remember these rates are averages for entire countries some areas in each country will have far exceeded these rates.
The graph could be a bit better if they didn’t make several of the colors almost the same.
Related: More Non Bubble Bursting in Housing – Europe and USA Housing Price Boom – How Not to Convert Equity – 30 year fixed Mortgage Rates
Comments
1 Comment so far
“The average U.K. asking price fell 3.2 percent to 232,396 pounds ($473,437) from November, the largest decline since the survey of real-estate agents’ listings began in 2002…”