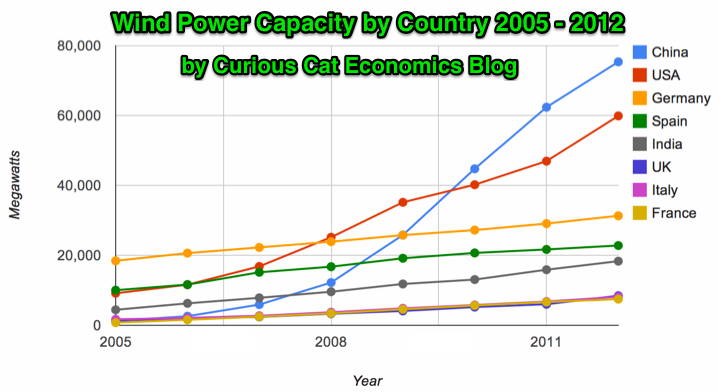
Global wind power capacity has increased 391% from 2005 to 2012. The capacity has grown to over 3% of global electricity needs.

Chart by Curious Cat Economics Blog using data from the Wind Energy Association. Chart may be used with attribution as specified here.
The 8 countries shown on the chart account for 82% of total wind energy capacity globally. From 2005 to 2012 those 8 countries have accounted for between 79 and 82% of total capacity – which is amazingly consistent.
Japan and Brazil are 13th and 15th in wind energy capacity in 2012 (both with just over one third of France’s capacity). Japan has increased capacity only 97% from 2005 to 2012 and just 13% from 2010 to 2012. Globally wind energy capacity increased 41% from 2010 to 2012. The leading 8 countries increased by 43% collectively lead by China increasing by 68% and the USA up by 49%. Germany added only 15% from 2010 through 2012 and Spain just 10%.
Brazil has been adding capacity quickly – up 170% from 2010 through 2012, by far the largest increase for a county with significant wind energy capacity. Mexico, 24th in 2012, is another country I would expect to grow above the global rate in the next 10 years (I also expect Brazil, India and Japan to do so).
In 2005 China accounted for 2% of wind energy capacity globally they accounted for 30% in 2012. The USA went from 15% to 24%, Germany from 31% to 12%, Spain from 17% to 9% and India from 8% to 7%.
Related: Global Wind Energy Capacity Exceeds 2.5% of Global Electricity Needs (2011) – Nuclear Power Generation by Country from 1985-2010 – Chart of Wind Power Generation Capacity Globally 2005 to 2012 (through June)
Comments
1 Comment so far
[…] Chart of Global Wind Energy Capacity by Country 2005 to 2012 – In 2010 Global Wind Energy Capacity Exceeded 2.5% of Global Electricity Needs – […]