• curiouscat.com
  • About
  • Books
  • Glossary

    Categories

    • All
    • carnival (41)
    • chart (8)
    • Cool (35)
    • Credit Cards (45)
    • economic data (62)
    • Economics (439)
    • economy (126)
    • Financial Literacy (292)
    • Investing (324)
    • Personal finance (356)
    • Popular (43)
    • quote (194)
    • Real Estate (120)
    • Retirement (65)
    • Saving (90)
    • Stocks (158)
    • Taxes (51)
    • Tips (129)
    • Travel (7)

    Tags

    Asia banking bonds capitalism chart China commentary consumer debt Credit Cards credit crisis curiouscat debt economic data Economics economy employment energy entrepreneur Europe Financial Literacy government health care housing India interest rates Investing Japan John Hunter manufacturing markets micro-finance mortgage Personal finance Popular quote Real Estate regulation Retirement save money Saving spending money Stocks Taxes Tips USA

    Recently Posts

    • New Health Care Insurance Subsidies in the USA
    • Individual Stock Portfolio Investment Planning
    • Finding Great Investments Keeps Getting Harder
    • Huge Growth in USA Corporate Debt from 2005 to 2020
    • Retirement Portfolio Allocation for 2020
    • Tencent Gaming
    • Tucows: Building 3 Businesses With Strong Positive Cash Flow
    • The 20 Most Valuable Companies in the World – Jan 2019
    • 20 Most Popular Posts on the Curious Cat Investing and Economics Blog in 2018
    • An Inverted Yield Curve Predicts Recessions in the USA
  • Blogroll

    • Curious Cat Management Improvement Blog
    • Freakonomics
    • I Will Teach You to be Rich
    • Jubak Picks
  • Links

    • Articles on Investing
    • fool.com
    • Investing Books
    • Investment Dictionary
    • Leading Investors
    • Marketplace
    • Trickle Up
  • Subscribe

    • RSS Feed

    Curious Cat Kivans

    • Making a Difference

Investing and Economics Blog

Chart of Net Government Debt from 1980 to 2013 by Country

chart of Government debt from 1980 to 2013

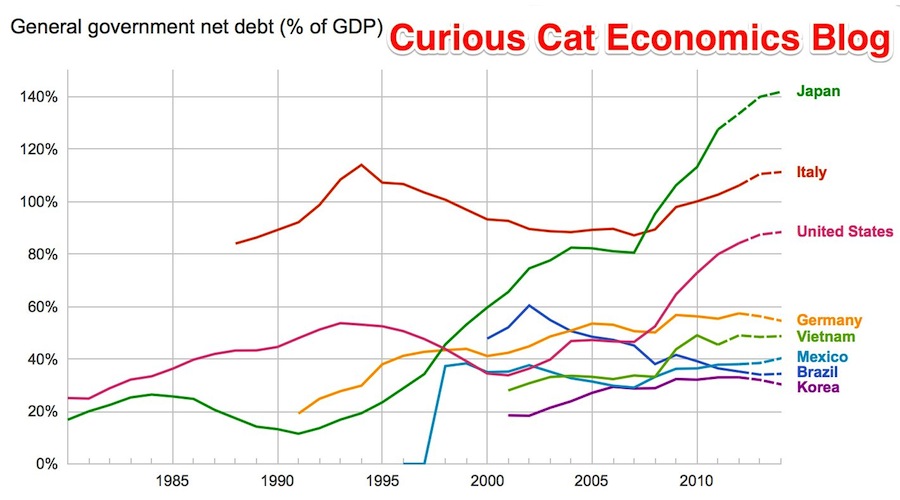
The data, from IMF, does not include China or India.

The chart shows data for net debt (gross debt reduced by certain assets: gold, currency deposits, debt securities etc.).

Bloomberg converted [broken link was removed] the data to look at debt load per person (looking at gross debt – estimated for 2014). Japan has ill-fortune to lead in this statistic with $99,725 in debt per person (242% of GDP), Ireland is in second with $60, 356 (121% of GDP). USA 3rd $58,604 (107%). Singapore 4th $56,980 (106%). Italy 6th $46,757 (133%). UK 9th $38,939 (95%). Greece 12th $38,444 (174%). Germany 14th $35,881 (78%). Malaysia 32nd $6,106 (57%). China 48th $1,489 (21%). India 53rd $946 (68%). Indonesia 54th $919 (27%).

I think the gross debt numbers can be more misleading than net debt figures. I believe Singapore has very large assets so that the “net” debt is very small (or non-existent). Japan is 242% in gross debt to GDP but 142% of net debt (which is still huge but obviously much lower). The USA in contrast has gross debt at 107% with a net debt of 88%.

Related: Government Debt as Percent of GDP 1998-2010 for OECD – Gross Government Debt as Percentage of GDP 1990-2009: USA, Japan, Germany, China – Chart of Largest Petroleum Consuming Countries from 1980 to 2010 – Top Countries For Renewable Energy Capacity

February 18th, 2014 by John Hunter | 1 Comment | Tags: chart, economic data

Cockroach Portfolio

Dylan Grice suggests the Cockroach Portfolio: 25% cash; 25% government bonds; 25% equities; and 25% gold. What we can learn from the cockroach

Each of those asset buckets protects against a different type of risk. And that is a very sensible approach to investing in the year ahead. Cash will protect you against a market collapse in anything (provided it’s cash held with a solid institution).

Government bonds protect against deflation (provided your money’s invested in solid government bonds and not trash). Equities offer capital growth and income. And gold, as we know, protects against currency depreciation, inflation, and financial collapse. It’s vitally important to maintain holdings in each, in my opinion.

The beauty of a ‘static’ allocation across these four asset classes is that it removes emotion from the investment process.

I don’t really agree with this but I think it is an interesting read. And I do agree the standard stock/bond/cash portfolio model is not good enough.

I would rather own real estate than gold. I doubt I would ever have more than 5% gold and only would suggest that if someone was really rich (so had money to put everywhere). Even then I imagine I would balance it with investments in other commodities.

One of the many problems with “stock” allocations is that doesn’t tell you enough. I think global exposure is wise (to some extent S&P 500 does this as many of those companies have huge international exposure – still I would go beyond that). Also I would be willing to take some stock in commodities type companies (oil and gas, mining, real estate, forests…) as a different bucket than “stocks” even though they are stocks.

And given the super low interest rates I see dividend paying stocks as an alternative to bonds.

The Cockroach Portfolio does suggest only government bonds (and is meant for the USA where those bonds are fairly sensible I think) but in the age of the internet many of my readers are global. It may well not make sense to have a huge portion of your portfolio in many countries bonds. And outside the USA I wouldn’t have such a large portion in USA bonds. And they don’t address the average maturity (at least in this article) – I would avoid longer maturities given the super low rates now. If rates were higher I would get some long term bonds.

photo with view of Glacier National Park,

View of Glacier National Park, from Bears Hump Trail in Waterton International Peace Park in Canada, by John Hunter

These adjustments mean I don’t have as simple a suggestion as the cockroach portfolio. But I think that is sensible. There is no one portfolio that makes sense. What portfolio is wise depends on many things.

Read more

February 11th, 2014 by John Hunter | 5 Comments | Tags: Financial Literacy, Investing, Personal finance, quote, Real Estate, Stocks, Tips

           
Copyright © Curious Cat Investing and Economics Blog

    Personal Finance

    • Credit Card Tips
    • IRAs
    • Investment Risks
    • Loan Terms
    • Saving for Retirement
  • Archives

      All Posts
    • March 2021
    • January 2021
    • August 2020
    • March 2020
    • February 2020
    • January 2020
    • May 2019
    • January 2019
    • December 2018
    • November 2018
    • October 2018
    • August 2018
    • May 2018
    • February 2018
    • January 2018
    • November 2017
    • October 2017
    • September 2017
    • August 2017
    • July 2017
    • May 2017
    • April 2017
    • March 2017
    • February 2017
    • January 2017
    • December 2016
    • November 2016
    • October 2016
    • September 2016
    • August 2016
    • July 2016
    • June 2016
    • May 2016
    • April 2016
    • March 2016
    • February 2016
    • January 2016
    • December 2015
    • November 2015
    • October 2015
    • September 2015
    • August 2015
    • July 2015
    • June 2015
    • May 2015
    • April 2015
    • March 2015
    • February 2015
    • January 2015
    • December 2014
    • November 2014
    • October 2014
    • September 2014
    • August 2014
    • June 2014
    • April 2014
    • March 2014
    • February 2014
    • January 2014
    • December 2013
    • November 2013
    • September 2013
    • August 2013
    • July 2013
    • June 2013
    • May 2013
    • April 2013
    • March 2013
    • February 2013
    • January 2013
    • December 2012
    • November 2012
    • October 2012
    • September 2012
    • August 2012
    • July 2012
    • June 2012
    • May 2012
    • April 2012
    • March 2012
    • February 2012
    • January 2012
    • December 2011
    • November 2011
    • October 2011
    • September 2011
    • August 2011
    • July 2011
    • June 2011
    • May 2011
    • April 2011
    • March 2011
    • February 2011
    • January 2011
    • December 2010
    • November 2010
    • October 2010
    • September 2010
    • August 2010
    • July 2010
    • June 2010
    • May 2010
    • April 2010
    • March 2010
    • February 2010
    • January 2010
    • December 2009
    • November 2009
    • October 2009
    • September 2009
    • August 2009
    • July 2009
    • June 2009
    • May 2009
    • April 2009
    • March 2009
    • February 2009
    • January 2009
    • December 2008
    • November 2008
    • October 2008
    • September 2008
    • August 2008
    • July 2008
    • June 2008
    • May 2008
    • April 2008
    • March 2008
    • February 2008
    • January 2008
    • December 2007
    • November 2007
    • October 2007
    • September 2007
    • August 2007
    • July 2007
    • June 2007
    • May 2007
    • April 2007
    • March 2007
    • February 2007
    • January 2007
    • December 2006
    • November 2006
    • October 2006
    • April 2006
    • March 2006
    • January 2006
    • December 2005
    • October 2005
    • July 2005
    • May 2005
    • April 2005
    • April 2004