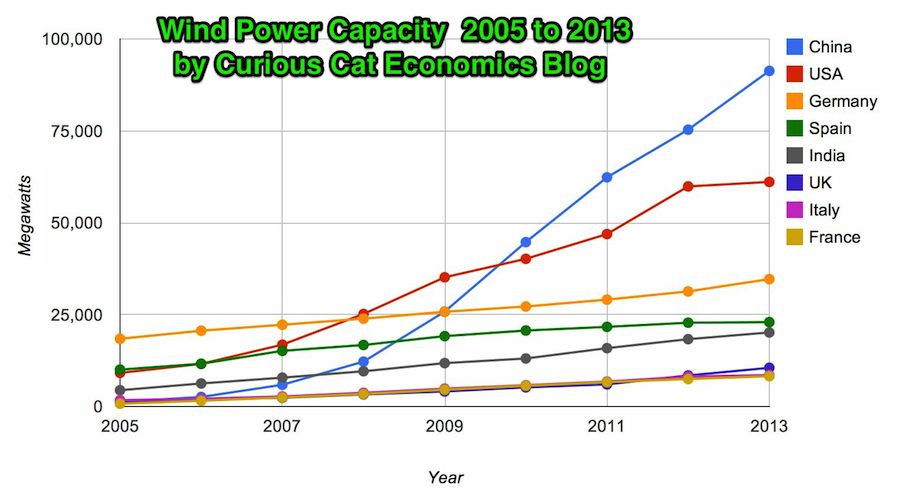
Chart by Curious Cat Economics Blog using data from the Wind Energy Association. Chart may be used with attribution as specified here.
In 2013 the addition to wind power capacity slowed a great deal in most countries. Globally capacity was increased just 13% (the increases in order since 2006: 26%, 27%, 29%, 32%, 25%, 19% and again 19% in 2012). China alone was responsible for adding 16,000 megawatts of the 25,838 total added globally in 2013.
At the end of 2013 China had 29% of global capacity (after being responsible for adding 62% of all the capacity added in 2013). In 2005 China had 2% of global wind energy capacity.
The 8 countries shown on the chart account for 81% of total wind energy capacity globally. From 2005 to 2013 those 8 countries have accounted for between 79 and 82% of total capacity – which is amazingly consistent.
Wind power now accounts for approximately 4% of total electricity used.
Related: Chart of Global Wind Energy Capacity by Country 2005 to 2012 – In 2010 Global Wind Energy Capacity Exceeded 2.5% of Global Electricity Needs – Global Trends in Renewable Energy Investment – Nuclear Power Generation by Country from 1985-2010
Countries where wind power accounts for the largest total shares of electricity: Denmark 34%, Spain 21%, Portugal 19%, Ireland 16%, Germany 9%.
The USA installed just 1 GW (gigawatts) in 2013, compared to 13 GW in 2012. That left the USA solidly in 2nd place (China 91 GW, USA 61 GW, Germany 35 GW, Spain 23 GW). The USA now accounts for 19% of global installed capacity the lowest percentage since 2007.
Comments
1 Comment so far
[…] After a slowing of additional capacity added in 2013, both 2014 and 2015 saw a bit of a rebound in additions to global wind energy capacity. In 2013 capacity increased only 13% while in both 2014 and 2015 it increased 17%. Still 17% is less than any year in the last 10, except 2013. […]