This is a continuation of my previous post: Investing in Peer to Peer Loans
LendingClub suggest a minimum of 100 loans (of equal size) to escape the risk of your luck with individual loans causing very bad results. Based on this diversity the odds of avoiding a loss have been very good (though that obviously isn’t a guarantee of future performance), quote from their website (Nov 2015):
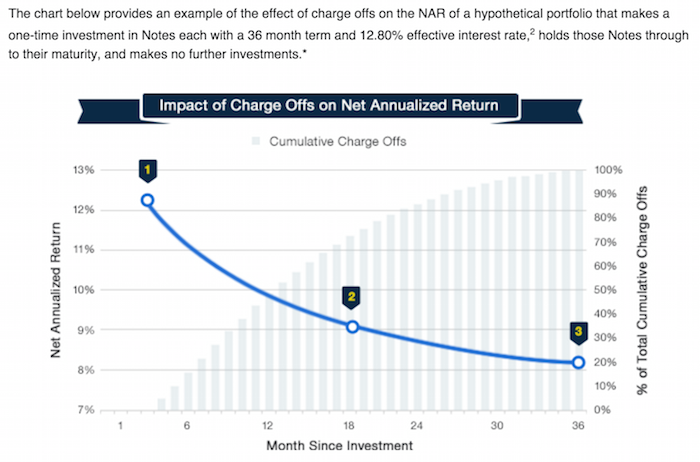
This chart, from LendingClub, shows a theoretical (not based on past performance) result. The basic idea is that as the portfolio ages, more loans will default and thus the portfolio return will decline. This contrasts with other investments (such as stocks) that will show fluctuating returns going up and down (over somewhat dramatically) over time.
For portfolios of personal loans diversity is very important to avoid the risk of getting a few loans that default destroying your portfolio return. For portfolios with fewer than 100 notes the negative returns are expected in 12.8% of the cases (obviously this is a factor of the total loans – with 99 loans it would be much less likely to be negative, with 5 it would be much more likely). I would say targeting at least 250 loans with none over .5% would be better than aiming at just 100 loans with none over 1% of portfolio.
There are several very useful sites that examine the past results of Lending Club loans and provide some suggestions for good filters to use in selecting loans. Good filters really amount to finding cases where Lending Club doesn’t do the greatest job of underwriting. So for example many say exclude loans from California to increase your portfolio return. While this may well be due to California loans being riskier really underwriting should take care of that by balancing out the risk v. return (so charging higher rates and/or being more stringent about taking such loans.
So I would expect Lending Club to adjust underwriting to take these results into account and thus make the filters go out of date. Of course this over simplifies things quite a bit. But the basic idea is that much of the value of filters is to take advantage of underwriting weaknesses.

This chart (for 36 month loans) is an extremely important one for investors in peer to peer loans. It shows the returns over the life of portfolios as the portfolio ages. And this chart (for LendingClub) shows the results for portfolios of loans issued each year. This is a critical tool to help keep track to see if underwriting quality is slipping.
Peer to peer lending has grown dramatically the last few years in the USA. The largest platforms are Lending Club (you get a $25 bonus if you sign up with this link – I don’t think I get anything?) and Prosper. I finally tried out Lending Club starting about 6 months ago. The idea is very simple, you buy fractional portions of personal loans. The loans are largely to consolidate debts and also for things such as a home improvement, major purchase, health care, etc.).
With each loan you may lend as little as $25. Lending Club (and Prosper) deal with all the underwriting, collecting payments etc.. Lending Club takes 1% of payments as a fee charged to the lenders (they also take fees from the borrowers).
Borrowers can make prepayments without penalty. Lending Club waives the 1% fee on prepayments made in the first year. This may seem a minor point, and it is really, but a bit less minor than I would have guessed. I have had 2% of loans prepaid with only an average of 3 months holding time so far – much higher than I would have guessed.
On each loan you receive the payments (less a 1% fee to Lending Club) as they are made each month. Those payments include principle and interest.

This chart shows the historical performance by grade for all issued loans that were issued 18 months or more before the last day of the most recently completed quarter. Adjusted Net Annualized Return (“Adjusted NAR”) is a cumulative, annualized measure of the return on all of the money invested in loans over the life of those loans, with an adjustment for estimated future losses. From LendingClub web site Nov 2015, see their site for updated data.
Lending Club provides you a calculated interest rate based on your actual portfolio. This is nice but it is a bit overstated in that they calculate the rate based only on invested funds. So funds that are not allocated to a loan (while they earn no interest) are not factored in to your return (though they actually reduce your return). And even once funds are allocated the actual loan can take quite some time to be issued. Some are issued within a day but also I have had many take weeks to issue (and some will fail to issue after weeks of sitting idle). I wouldn’t be surprised if Lending Club doesn’t start considering funds invested until the loan is issued (which again would inflate your reported return compared to a real return), but I am not sure how Lending Club factors it in.
Total nonfarm payroll employment increased by 271,000 in October, and the unemployment rate was essentially unchanged at 5.0%. Over the prior 12 months, employment growth had averaged 230,000 per month – which is quite an excellent result. We are still recovering from the job losses suffered during the great recession but even considering that the results are excellent.
As my recent post noted, adding 50,000 jobs a month is the new 150,000 in the USA due to demographic changes. That means job gains in the last year have added about 180,000 jobs per month above the 50,000 needed to accommodate growth due to demographic changes (a larger population of adults.
The change in total nonfarm payroll employment for August was revised from +136,000 to +153,000, and the change for September was revised from +142,000 to +137,000. With these revisions, employment gains in August and September combined were 12,000 more than previously reported.
Household Survey Data
Both the unemployment rate (5.0%) and the number of unemployed persons (7.9 million) were essentially unchanged in October. Over the past 12 months, the unemployment rate dropped by 70 basis (from 5.7%) and 1.1 million fewer people are listed as unemployed.
Among the major worker groups, the unemployment rates for adult men (4.7%), adult women (4.5%), teenagers (15.9%), whites (4.4%), blacks (9.2%), Asians (3.5%), and Hispanics (6.3%) showed little or no change in October.
The number of long-term unemployed (those jobless for 27 weeks or more) was essentially unchanged at 2.1 million in October and has shown little change since June. These individuals accounted for 26.8% of the unemployed in October.
The 20 publicly traded companies with the largest market capitalizations. Since my June list of the top 20 stocks many of the market caps have declined slightly.
| Company | Country | Market Capitalization | |
|---|---|---|---|
| 1 | Apple | USA | $672 billion |
| 2 | USA | $497 billion | |
| 3 | Microsoft | USA | $426 billion |
| 4 | Exxon Mobil | USA | $342 billion |
| 5 | Berkshire Hathaway | USA | $340 billion |
| 6 | GE | USA | $296 billion |
| 7 | USA | $295 billion | |
| 8 | Amazon | USA | $294 billion |
| 9 | Wells Fargo | USA | $282 billion |
| 10 | Johnson & Johnson | USA | $281 billion |
Google and Amazon were star performers in the last 4 months with Google up $127 billion and Amazon increasing $96 billion moving Amazon from outside the top 20 into 8th place. Facebook increased in value by $64 billion and moved from the 18th largest market cap to 7th. The China market declined quite rapidly since June and the largest Chinese companies saw significant drops in market cap.
Industrial & Commercial Bank of China and China Mobile dropped from the top 10 (replaced by Facebook and Amazon). That results in USA companies holding the top 10 spots (the next 5 are either Chinese or Swiss).
The next ten most valuable companies:
| Company | Country | Market Capitalization | |
|---|---|---|---|
| 11 | Industrial & Commercial Bank of China | China | $250 billion* |
| 12 | China Mobile | China | $247 billion |
| 13 | Novartis | Switzerland | $243 billion |
| 14 | Petro China | China | $241 billion |
| 15 | Nestle | Switzerland | $241 billion |
| 16 | JPMorgan Chase | USA | $241 billion |
| 17 | Hoffmann-La Roche | Switzerland | $231 billion |
| 18 | Pfizer | USA | $214 billion |
| 19 | Toyota | Japan | $211 billion |
| 20 | Procter & Gamble | USA | $210 billion |
Market capitalization shown are of the close of business October 30th, as shown on Google Finance.
The 11th to 20th most valuable companies includes 3 Chinese companies, 3 USA companies, 3 Swiss companies and 1 Japanese company. Alibaba, Tencent, China Construction Bank and Walmart dropped out of the top 20 (replaced by Amazon, Pfizer, Proctor & Gamble and Toyota). Alibaba remained above $200 in market cap making it the only company worth more than 200 billion that missed the cut. In the top 20 the USA gained 2 spots, China lost 3 and Japan gained 1.
The total value of the top 20 has barely changed since my June post on the top 20 most valuable companies in the world: from $6.046 trillion to $6.054 trillion. Since my October 2014 post of the 20 most valuable companies in the world the total value of the top 20 companies has risen from $5.722 trillion to $6.054 trillion, an increase of $332 billion. Several companies have been replaced in the last year to create the current top 20 list.
Related: Global Stock Market Capitalization from 2000 to 2012 – Stock Market Capitalization by Country from 1990 to 2010 – Historical Stock Returns
A few other companies of interest (based on their market capitalization):
Read more