Today there are more ways to invest your money than ever before. Alternative investments can help provide counterweights to more common investments.
Historical documents are important pieces of cultural memorabilia that are sought after by personal collectors, museums and universities. Given the prestige of the collectors, historical documents can go for top dollar. In one recent example, Bill Gates purchased the Codex Leicester for over $30 million.
Historical documents can be a great addition to any portfolio, but one word of caution: authenticity is critical. Far too many investors have been bamboozled by counterfeit documents. Raab Collection, an internationally recognized proprietor of historical documents, stresses the importance of due diligence. When they help clients such as the Library of Congress build their collections, every step possible is taken to authenticate a document before striking a deal.
Here are four other factors that should be considered before making your first historical document investment:
Plan for Preservation
The older historical documents get the more valuable they become – as long as they are properly preserved. The condition of the document is second only to authenticity when it comes to value.
Before you take ownership of a historical document, it’s a good idea to have a plan in place for how the document will be stored. Documents should be kept in waterproof, airtight containers that protect the fibers from the elements. UV radiation can also degrade paper overtime, which is why storing historic documents out of direct sunlight is always advised.
Protecting Your Investment
Unlike stocks and mutual funds, physical assets can be destroyed or stolen. Historical documents have to be treated like fine art. They should be insured and some form of theft protection should be put in place. Documents can be stored in a fireproof lockbox and/or stored in a bank safe under lock and key.
Get Documents Appraised
Professional appraisals are important for historical collectables. An appraisal will give you an official estimate of the value, which can be used for securing insurance. Appraisals also give you a better idea of an acceptable price when it comes time to sell off your investment.
Keep Track of the Market and Trends
You won’t be checking stats daily like the stock market, but keeping up with historical document sales is needed to ensure you make the best decisions for your investment. After all, making money on investments hinges on knowing when to buy and when to sell. Knowing what’s happening in the market will help you determine when the time is ripe to sell or whether you should hold onto your asset a little longer. Demand for historical documents tends to be higher than supply, but catching things right when interest is trending upward can help you make the most profit possible.
Historical and autographed documents have always been popular collectibles, but now more people are beginning to realize their investment potential. Every year countless documents are sold privately and at auction for thousands and even millions of dollars. Investors that seek professional guidance before buying and take care to preserve their asset will be able to grow their portfolio or retirement nest egg by simply holding on to a piece of history.
In general alternative investments (historical documents, art, coins, collectibles etc.) should make up a small portion, under 5%, of an investment portfolio. Another investment that isn’t quite normal, but isn’t really considered a normal investment either is peer to peer loans. We have written about peer to peer loans several times on this blog recently, I would consider under 5% for peer to peer loans acceptable but would consider that part of the bond portion of a portfolio.
Credit scores are far from a great measure of whether a person is a great credit risk for a specific loan, in my opinion. However, they are very widely used and therefor, very important. They also are somewhat useful. And lenders don’t base judgement solely on credit scores, they consider many other factors, if they have any sense at all.
Credit scores range from 300 to 850. They are calculated by various credit reporting organizations, including FICO. They factor in payment history, percent of outstanding credit available that is used, credit report checks, length of outstanding credit accounts, etc..
Metlife report on consumers and credit scores provides some interesting data.
| Credit score range | Default rate* |
|---|---|
| 740-850 | .4% |
| 680-739 | 2.8% |
| 620-679 | 7.5% |
| 550-619 | 17% |
| 300-459 | 33.8% |
* Default rate in this case means, 90 days past due. MetLife got this data from the Consumer Financial Health Study dataset**.
Peer to peer lending platform, Lending Club, limits loans to those with a minimum credit score of 660 (remember there are multiple organizations that provide credit scores, this minimum is based on Lending Club’s score). In general I see scores above 700 in A and B loans, scores from 650-700 in C and D loans. Remember the credit score is not the only factor setting the rate (you will see scores above 700 in the C loans sometimes, etc.). Credit scores provide some insight but are just 1 factor in approving loans or setting rates (an important one but not a completely dominant one).
About 38% of people have credit scores from 750-850. Another 37% from 600-749 and about 25% from 350-599.
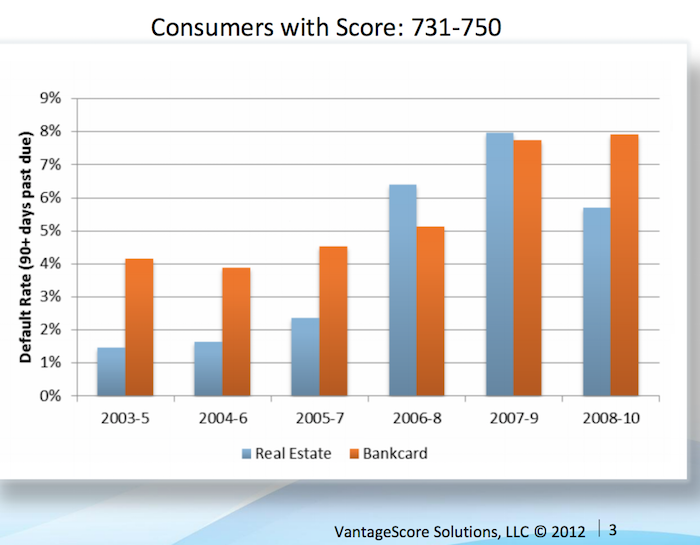
Vantage Score decided to make their score range go up to 1000, not the standard 850. Maybe a 750 score for them is comparable to 680? They say super-prime is 900+ (750-850 on more common scale), prime is 701-900 (680-739), near-prime 641-700 (620-679), subprime 501-640 (550-619). Anyway that chart shows the changing default rates from 2003 to 2010 by type of loan.
This Federal Reserve report on meeting between Federal Reserve Board staff and Fair Isaac Corporation (FICO) 20 June 2013 has some interesting material.
For guidance, the following table generally matches a borrower’s odds-of-default with the corresponding FICO 8 score (calculated on performance from Oct 2008 – Oct 2010). Of course, the range of scores and odds-of-default [the data is related to mortgages] will vary with each model as creditors develop and validate their own credit scoring models.
Odds-of Default FICO 8 Score percent of population** 5:1 610 9% 10:1 645 9% 20:1 685 6% 30:1 705 6% 40:1 720 6% 50:1 735 9% 100:1 770 30%
As you can see at a 610 level, 20 loans out of 100 defaulted. At 685 just 5 in 100 defaulted and at 770 just 1 in 100 did.
** I had to adjust this, because the report didn’t report it in this form, so it a very approximate measure (I made estimates for something like scores from 735 to 769 etc.). Again this is data from the Oct 2008 – Oct 2010 period. The rest of the population (about 25%) would have scores below 610.
Related: The Impact of Credit Scores and Jumbo Size on Mortgage Rates (2009) – Your FICO credit score explained – $2,540,000,000,000 in USA Consumer Debt
This page references a Fed report (that I can’t find) that found the following default rates on new loans for the two years after origination, 2000-2002:
| Credit score range | Default rate* |
|---|---|
| under 520 | 41% |
| 520-559 | 28% |
| 560-599 | 23% |
| 600-639 | 16% |
| 640-679 | 9% |
| 680-719 | 4.4% |
| over 720 | <1% |
The Consumer Financial Health Study respondents were asked to self-assess their credit quality and for permission to pull their actual credit scores.8 Forty-five percent of survey participants granted permission, yielding an “opt-in” sample size of 3,215. We appended two objective measures of creditworthiness to the dataset: Experian provided VantageScore 3.0 credit scores, and LexisNexis Risk Solutions provided RiskView scores. VantageScore is a generic credit scoring model that was created by the three major credit bureaus (Equifax, Experian and TransUnion) and, in addition to tradeline data, includes rent, utility and cell phone payment data when it is available in consumer credit files.
Health insurance options are confusing for those of us in the USA (those outside the USA are free of the frustrations of USA health care system). One of the features of a health insurance plan in the USA is the out-of-pocket “maximum.”
Now if you think you understand english you might think this is the maximum you have to pay out of your pocket. If you understand how horrible the USA health care system is and how nothing is easy, you probably suspect it isn’t a maximum at all. I find myself thinking that I don’t really understand what this seemingly simple value actually means, so I decided to research it and write this blog post.
First of all you have to pay the monthly premiums (assuming your employer doesn’t pay them for you), probably a few hundred or more dollars every month. Then the coverage likely has a deductible maximum for the year.
For this example, for 1 person the insurance costs $300/month with a yearly deductible maximum of $5,000. And the insurance plan says there is an out-of-pocket “maximum” of $6,500. Well 12 *$300 + $5,000 = $8,600. So, as you can probably guess, out-of-pocket “maximum” doesn’t actually mean the maximum out of your pocket. In fact the $8,600 is excluded from the out-of-pocket maximum calculation altogether.
So, you then might think ok, my actual out-of-pocket maximum (the most I will have to pay all year for health care) is $8,600 + $6,500 = $15,100. But that isn’t right either.
First, this is only for covered medical expenses, uncovered medical expenses are not included. This makes some sense, certainly, but in your planning, you can’t think your health care costs are capped at $15,100. Especially since in the USA lots of health care will be uncovered (dental care is often excluded, mental health care may well be limited, certain types of treatment may not be covered, prescription glasses, non-prescription drugs, addiction treatment…).
Remember, USA health care coverage isn’t even just limited by the type of care. For example, even if fixing your injured leg is covered, if you don’t do it using exactly the right places (where your health plan covers the cost), it may be considered to be uncovered care. In general, emergency care is more flexible for what is covered, but the horror stories of dealing with health insurers refusal to pay for provided health care adds risk to any health care someone gets in the USA.
Here is a good explanation of out-of-pocket cost questions (in this quote looking at out of network costs): “Out of Pocket Maximum” and health insurance plan terminology and calculation?