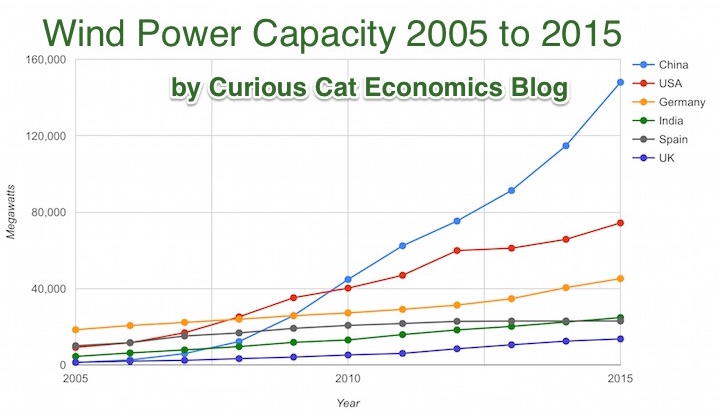
Chart by Curious Cat Economics Blog using data from the Wind Energy Association, data for 2014 and 2015. Chart may be used with attribution as specified here.
After a slowing of additional capacity added in 2013, both 2014 and 2015 saw a bit of a rebound in additions to global wind energy capacity. In 2013 capacity increased only 13% while in both 2014 and 2015 it increased 17%. Still 17% is less than any year in the last 10, except 2013.
At the end of 2013 China had 29% of global capacity (after being responsible for adding 62% of all the capacity added in 2013). In 2005 China had 2% of global wind energy capacity.
At the end of 2015 China accounted for 34% of global capacity, the only country in the top 8 increasing their share of global capacity. The USA now has 17% of capacity. Germany has 10%.
Europe moved first in adding large scale wind energy capacity but has added capacity very slowly in the last 5 years. Germany had 31% of global capacity in 2005. Spain had 17% in 2005 and now has just 5% (during that time Spain has more than doubled their wind energy capacity).
The 6 countries shown on the chart account for 76% of total wind energy capacity globally. From 2005 to 2015 those 8 countries have accounted for between 74 and 77% of total capacity – which is amazingly consistent.
Wind power now accounts for approximately 4 to 5% of total electricity used.
Related: Chart of Global Wind Energy Capacity by Country 2005 to 2013 – Solar Energy Capacity by Country (2005 to 2013) – Nuclear Power Generation by Country from 1985-2010 – Chart of Largest Petroleum Consuming Countries from 1980 to 2010