The Federal Reserve Bank of New York’s Center for Microeconomic Data today issued its Quarterly Report on Household Debt and Credit, which reported that total household debt increased by $193 billion (1.5%) to $13.15 trillion in the fourth quarter of 2017. This report marks the fifth consecutive year of positive annual household debt growth. There were increases in mortgage, student, auto, and credit card debt (increasing by 1.6%, 1.5%, 0.7% and 3.2% respectively) and another modest decline in home equity line of credit (HELOC) balances (decreasing by 0.9%).
Outstanding consumer debt balances by type: $8.88 trillion (mortgage), $1.38 trillion (student loans), $1.22 trillion (auto), $834 billion (credit card), $444 (HELOC).
Mortgages are the largest form of household debt and their increase of $139 billion was the most substantial increase seen in several quarters. Unlike overall debt balances, which last year surpassed their previous peak reached in the third quarter of 2008, mortgage balances remain 4.4% below it. The New York Fed issued an accompanying blog post to examine the regional differences in mortgage debt growth since the previous peak.

As of December 31, 4.7% of outstanding debt was in some stage of delinquency. As the chart shows mortgage and credit card debt delinquency rates have decreased sharply since 2010. Student loan debt delinquency rates have increased substantially during the same period (and delinquency rates for student loans are likely to understate effective delinquency rates because about half of these loans are currently in deferment, in grace periods or in forbearance and therefore temporarily not in the repayment cycle. This implies that among loans in the repayment cycle delinquency rates are roughly twice as high). You can understand why many see student debt as a huge economic problem the economy is facing in the coming years.
Of the $619 billion of debt that is delinquent, $406 billion is seriously delinquent (at least 90 days late or “severely derogatory”). The flow into 90+ days delinquency for credit card balances has been increasing notably from the last year and the flow into 90+ days delinquency for auto loan balances has been slowly increasing since 2012.
I have decided to wind down my investment test with LendingClub. I should end up with a investment return of about 5% annually. So it beat just leaving the money in the bank. But returns are eroding more recently and the risk does not seem worth the returns.
Early on I was a bit worried by how often the loan defaulted with only 0, 1 or 2 payments made. Sure, there are going to be some defaults and sometimes in extremely unlucky situation it might happen right away. But the amount of them seems to me to indicate LendingClub fails to do an adequate job of screening loan candidates.
Over time the rates LendingClub quoted for returns declined. The charges to investors for collecting on late loans were very high. It was common to see charges 9 to 10 times higher as the investor than were charged to the person that took out the loan and made the late payment.
For the last 6 months my account balance has essentially stayed the same (bouncing within the same range of value). I stopped reinvesting the payments received from LendingClub loans several months ago and have begun withdrawing the funds back to my account. I will likely just leave the funds in cash to increase my reserves given the lack of appealing investment options (and also a desire to increase my cash position in given my personal finances now and looking forward for the next year). I may invest the funds in dividend stocks depending on what happens.
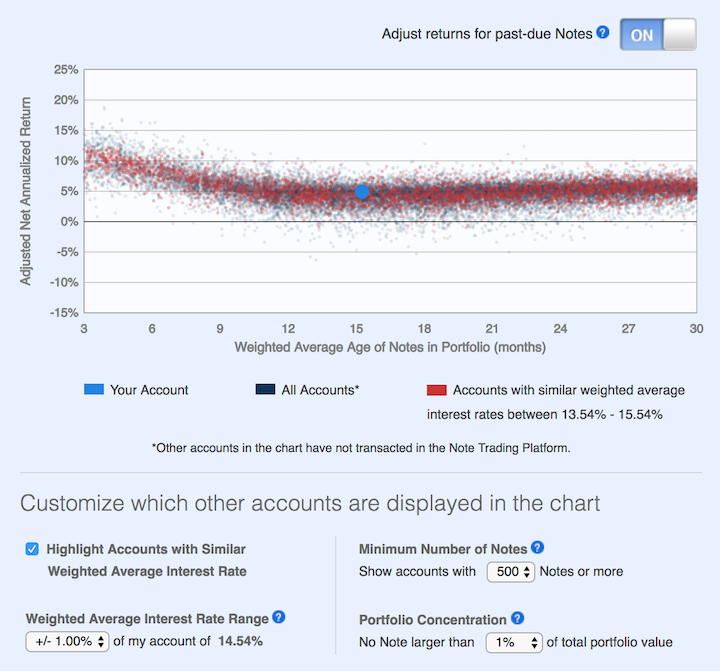
This chart shows lending club returns for portfolios similar to mine. As you can see a return of about 5% is common (which is about where I am). Quite a few more than before actually have negative returns. When I started, my recollection is that their results showed no losses for well diversified portfolios.
The two problems I see are poor underwriting quality and high costs that eat into returns. I do believe the peer to peer lending model has potential as a way to diversify investments. I think it can offer decent rates and provide some balance that would normally be in the bond portion of a portfolio allocation. I am just not sold on LendingClub’s execution for delivering on that potential good investment option. At this time I don’t see another peer to peer lending options worth exploring. I will be willing to reconsider these types of investments at a later time.
I plan to just withdraw money as payments on made on the loans I participated in through LendingClub.
Related: Peer to Peer Portfolio Returns and The Decline in Returns as Loans Age (2015) – Investing in Peer to Peer Loans – Looking for Yields in Stocks and Real Estate (2012) – Where to Invest for Yield Today (2010)
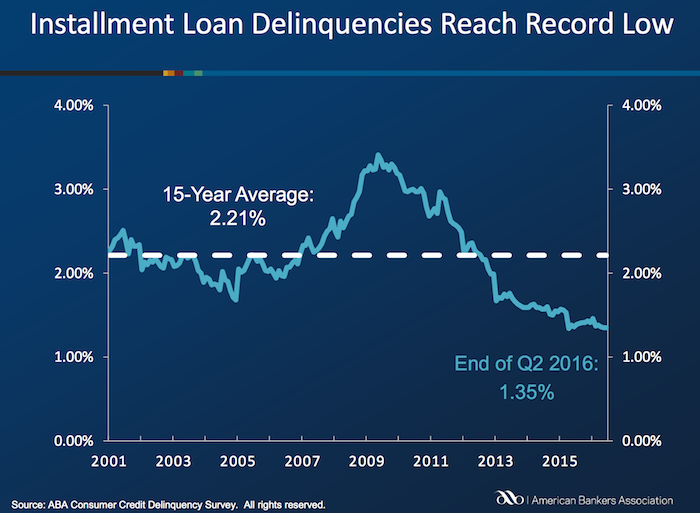
Delinquencies in closed-end loans fell slightly in the second quarter, driven by a drop in home equity loan delinquencies, according to results from the American Bankers Association’s Consumer Credit Delinquency Bulletin.
The composite ratio, which tracks delinquencies in eight closed-end installment loan categories, fell 3 basis points to 1.35% of all accounts – a record low. This also marked the third year that delinquency rates were below the 15-year average of 2.21%. The ABA report defines a delinquency as a late payment that is 30 days or more overdue. This is good news but the personal financial health of consumers in the USA is still in need of significantly improvements to their balance sheets. Debt levels are still too high. Savings levels are still far to low.
Home equity loan delinquencies fell 4 basis points to 2.70% of all accounts, which helped drive the composite ratio down. Other home related delinquencies increased slightly, with home equity line delinquencies rising 6 basis points to 1.21% of all accounts and property improvement loan delinquencies rising 2 basis points to 0.91% of all accounts. Home equity loan delinquencies dipped further below their 15-year average of 2.85%, while home equity line delinquencies remained just above their 15-year average of 1.15 percent.
Bank card delinquencies edged up 1 basis point to 2.48% of all accounts in the second quarter. They remain significantly below their 15-year average of 3.70 percent.
The second quarter 2016 composite ratio is made up of the following eight closed-end loans. All figures are seasonally adjusted based upon the number of accounts.
Closed-end loans
Home equity loan delinquencies fell from 2.74% to 2.70%.
Mobile home delinquencies fell from 3.41% to 3.17%.
Personal loan delinquencies fell from 1.44% to 1.43%.
Direct auto loan delinquencies rose from 0.81% to 0.82%.
Indirect auto loan delinquencies rose from 1.45% to 1.56%.
Marine loan delinquencies rose from 1.03% to 1.23%.
Property improvement loan delinquencies rose from 0.89% to 0.91%.
RV loan delinquencies rose from 0.92% to 0.96%.
Open-end loans
Bank card delinquencies rose from 2.47% to 2.48%.
Home equity lines of credit delinquencies rose from 1.15% to 1.21%.
Non-card revolving loan delinquencies rose from 1.57% to 1.65%.
Related: Debt Collection Increasing Given Large Personal Debt Levels (2014) – Consumer and Real Estate Loan Delinquency Rates from 2001 to 2011 in the USA – Good News: Credit Card Delinquencies at 17 Year Low (2011) – Real Estate and Consumer Loan Delinquency Rates 1998-2009 – The USA Economy Needs to Reduce Personal and Government Debt (2009)
Credit scores are far from a great measure of whether a person is a great credit risk for a specific loan, in my opinion. However, they are very widely used and therefor, very important. They also are somewhat useful. And lenders don’t base judgement solely on credit scores, they consider many other factors, if they have any sense at all.
Credit scores range from 300 to 850. They are calculated by various credit reporting organizations, including FICO. They factor in payment history, percent of outstanding credit available that is used, credit report checks, length of outstanding credit accounts, etc..
Metlife report on consumers and credit scores provides some interesting data.
| Credit score range | Default rate* |
|---|---|
| 740-850 | .4% |
| 680-739 | 2.8% |
| 620-679 | 7.5% |
| 550-619 | 17% |
| 300-459 | 33.8% |
* Default rate in this case means, 90 days past due. MetLife got this data from the Consumer Financial Health Study dataset**.
Peer to peer lending platform, Lending Club, limits loans to those with a minimum credit score of 660 (remember there are multiple organizations that provide credit scores, this minimum is based on Lending Club’s score). In general I see scores above 700 in A and B loans, scores from 650-700 in C and D loans. Remember the credit score is not the only factor setting the rate (you will see scores above 700 in the C loans sometimes, etc.). Credit scores provide some insight but are just 1 factor in approving loans or setting rates (an important one but not a completely dominant one).
About 38% of people have credit scores from 750-850. Another 37% from 600-749 and about 25% from 350-599.
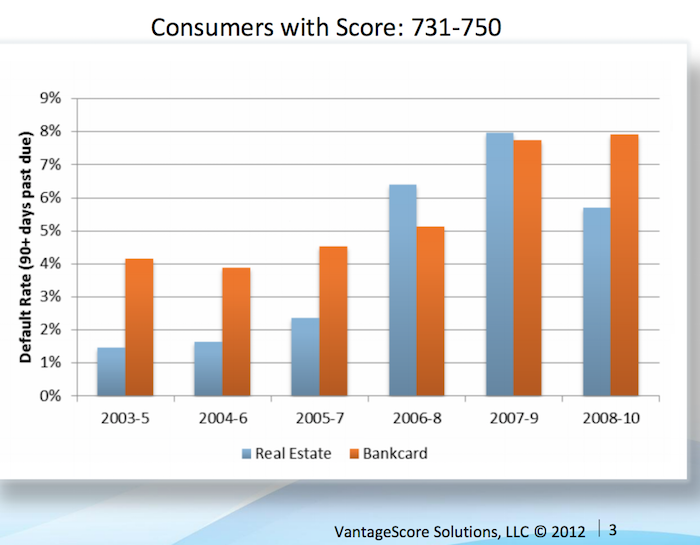
Vantage Score decided to make their score range go up to 1000, not the standard 850. Maybe a 750 score for them is comparable to 680? They say super-prime is 900+ (750-850 on more common scale), prime is 701-900 (680-739), near-prime 641-700 (620-679), subprime 501-640 (550-619). Anyway that chart shows the changing default rates from 2003 to 2010 by type of loan.
This Federal Reserve report on meeting between Federal Reserve Board staff and Fair Isaac Corporation (FICO) 20 June 2013 has some interesting material.
For guidance, the following table generally matches a borrower’s odds-of-default with the corresponding FICO 8 score (calculated on performance from Oct 2008 – Oct 2010). Of course, the range of scores and odds-of-default [the data is related to mortgages] will vary with each model as creditors develop and validate their own credit scoring models.
Odds-of Default FICO 8 Score percent of population** 5:1 610 9% 10:1 645 9% 20:1 685 6% 30:1 705 6% 40:1 720 6% 50:1 735 9% 100:1 770 30%
As you can see at a 610 level, 20 loans out of 100 defaulted. At 685 just 5 in 100 defaulted and at 770 just 1 in 100 did.
** I had to adjust this, because the report didn’t report it in this form, so it a very approximate measure (I made estimates for something like scores from 735 to 769 etc.). Again this is data from the Oct 2008 – Oct 2010 period. The rest of the population (about 25%) would have scores below 610.
Related: The Impact of Credit Scores and Jumbo Size on Mortgage Rates (2009) – Your FICO credit score explained – $2,540,000,000,000 in USA Consumer Debt
This page references a Fed report (that I can’t find) that found the following default rates on new loans for the two years after origination, 2000-2002:
| Credit score range | Default rate* |
|---|---|
| under 520 | 41% |
| 520-559 | 28% |
| 560-599 | 23% |
| 600-639 | 16% |
| 640-679 | 9% |
| 680-719 | 4.4% |
| over 720 | <1% |
The Consumer Financial Health Study respondents were asked to self-assess their credit quality and for permission to pull their actual credit scores.8 Forty-five percent of survey participants granted permission, yielding an “opt-in” sample size of 3,215. We appended two objective measures of creditworthiness to the dataset: Experian provided VantageScore 3.0 credit scores, and LexisNexis Risk Solutions provided RiskView scores. VantageScore is a generic credit scoring model that was created by the three major credit bureaus (Equifax, Experian and TransUnion) and, in addition to tradeline data, includes rent, utility and cell phone payment data when it is available in consumer credit files.
This is a continuation of my previous post: Investing in Peer to Peer Loans
LendingClub suggest a minimum of 100 loans (of equal size) to escape the risk of your luck with individual loans causing very bad results. Based on this diversity the odds of avoiding a loss have been very good (though that obviously isn’t a guarantee of future performance), quote from their website (Nov 2015):
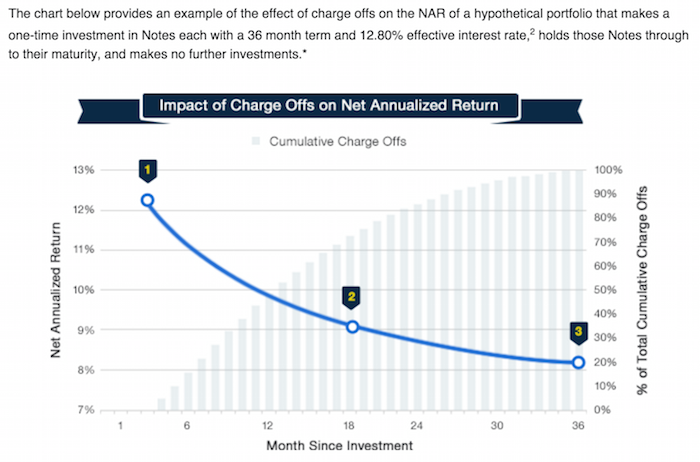
This chart, from LendingClub, shows a theoretical (not based on past performance) result. The basic idea is that as the portfolio ages, more loans will default and thus the portfolio return will decline. This contrasts with other investments (such as stocks) that will show fluctuating returns going up and down (over somewhat dramatically) over time.
For portfolios of personal loans diversity is very important to avoid the risk of getting a few loans that default destroying your portfolio return. For portfolios with fewer than 100 notes the negative returns are expected in 12.8% of the cases (obviously this is a factor of the total loans – with 99 loans it would be much less likely to be negative, with 5 it would be much more likely). I would say targeting at least 250 loans with none over .5% would be better than aiming at just 100 loans with none over 1% of portfolio.
There are several very useful sites that examine the past results of Lending Club loans and provide some suggestions for good filters to use in selecting loans. Good filters really amount to finding cases where Lending Club doesn’t do the greatest job of underwriting. So for example many say exclude loans from California to increase your portfolio return. While this may well be due to California loans being riskier really underwriting should take care of that by balancing out the risk v. return (so charging higher rates and/or being more stringent about taking such loans.
So I would expect Lending Club to adjust underwriting to take these results into account and thus make the filters go out of date. Of course this over simplifies things quite a bit. But the basic idea is that much of the value of filters is to take advantage of underwriting weaknesses.

This chart (for 36 month loans) is an extremely important one for investors in peer to peer loans. It shows the returns over the life of portfolios as the portfolio ages. And this chart (for LendingClub) shows the results for portfolios of loans issued each year. This is a critical tool to help keep track to see if underwriting quality is slipping.
Peer to peer lending has grown dramatically the last few years in the USA. The largest platforms are Lending Club (you get a $25 bonus if you sign up with this link – I don’t think I get anything?) and Prosper. I finally tried out Lending Club starting about 6 months ago. The idea is very simple, you buy fractional portions of personal loans. The loans are largely to consolidate debts and also for things such as a home improvement, major purchase, health care, etc.).
With each loan you may lend as little as $25. Lending Club (and Prosper) deal with all the underwriting, collecting payments etc.. Lending Club takes 1% of payments as a fee charged to the lenders (they also take fees from the borrowers).
Borrowers can make prepayments without penalty. Lending Club waives the 1% fee on prepayments made in the first year. This may seem a minor point, and it is really, but a bit less minor than I would have guessed. I have had 2% of loans prepaid with only an average of 3 months holding time so far – much higher than I would have guessed.
On each loan you receive the payments (less a 1% fee to Lending Club) as they are made each month. Those payments include principle and interest.

This chart shows the historical performance by grade for all issued loans that were issued 18 months or more before the last day of the most recently completed quarter. Adjusted Net Annualized Return (“Adjusted NAR”) is a cumulative, annualized measure of the return on all of the money invested in loans over the life of those loans, with an adjustment for estimated future losses. From LendingClub web site Nov 2015, see their site for updated data.
Lending Club provides you a calculated interest rate based on your actual portfolio. This is nice but it is a bit overstated in that they calculate the rate based only on invested funds. So funds that are not allocated to a loan (while they earn no interest) are not factored in to your return (though they actually reduce your return). And even once funds are allocated the actual loan can take quite some time to be issued. Some are issued within a day but also I have had many take weeks to issue (and some will fail to issue after weeks of sitting idle). I wouldn’t be surprised if Lending Club doesn’t start considering funds invested until the loan is issued (which again would inflate your reported return compared to a real return), but I am not sure how Lending Club factors it in.
Credit is the ability to buy now and pay later. It takes credit to get an auto loan, a mortgage and other types of financing. Your credit score says a lot about your credit habits. This is a three-digit number ranging from 300 to 850, and it tells creditors how likely you are to pay your bills. The higher your credit score, the better your chances of getting approved for financing and the lower your interest rate will be.
Credit has many benefits. Most people can’t pay cash for homes, college education or new cars. Without loans, buying a house or car would be impossible for many. And since it takes credit to build credit, many people apply for their first credit card in college to establish a credit history. A credit card also provides emergency funds when we’re short on cash.
Although we use credit regularly as consumers, there are dangers associated with credit. We can avoid some of these problems with responsible use. But unfortunately, credit management education isn’t taught in high school, and many adults don’t learn about credit management until after they’ve made mistakes.
Potential Dangers of Credit
Credit puts a lot of things within our financial reach, so it’s easy to get in over our heads. We might not have enough in savings to purchase an electronic device or take a vacation, but with one quick application, we can get approved for financing and take advantage of life’s pleasures. There’s nothing wrong with getting a loan. But some people can’t stop using credit and they get into serious debt.
Too much debt has a significant negative impact on your personal finances. Paying off that debt will reduce your available disposable income to build an emergency fund (if you haven’t done so already) or save for retirement a house or other large purchases.
Of course, debt isn’t the only thing to be concerned with. Getting credit also means you’re vulnerable to identity theft. This is one of the fastest growing crimes in the U.S. And while some people think it can’t happen to them, no one is invincible.
Keeping Your Credit Report Accurate
Identity theft involves someone stealing your personal information and purchasing items in your name or opening new accounts in your name. It can drive down your credit score and take several months or years to fix. Identity theft often goes unnoticed because some people never monitor their personal credit reports or file credit disputes
You might wonder, what is a credit dispute? As a consumer, you have the right to check your credit history and receive one free credit report from each of the bureaus annually. You are entitled to ask questions about anything included within your credit reports.Â
Personal debt levels in the USA continue to be alarmingly high. Thankfully in the last couple of years things have been moving slightly in the right direction. But the debt levels are still far too high.

via wikipedia
The chart shows USA household debt in the 60% range of disposable income in the 1980s. It isn’t as if the 1980s in the USA were some low debt era. Personal debt was high then. It rose into the 120% range in the last 10 years and in the last few years dipped to the 110% range.
Given the large amount of debt falling into collection managing that debt has becoming increasingly important to local banks and credit unions. Companies like, Intelligent Banking Solutions, are helping those institutions deal with collections while building a strong business themselves.
As consumers we need to use debt sparingly and without our means or be trapped in a personal financial crisis. It is hard enough to get ahead today without creating problems such as paying high interest rate debt or penalties and fees for failing to pay back your obligations as required.
Since I am living in Malaysia now, I pay attention to Malaysia’s economy. There are many reasons to be positive but the large consumer and government debt in Malaysia is a serious concern. They do have many administrators that say the right things, the question is going to be whether those statement define policy action or if they are ignored.
Wahid Says Ringgit Too Weak as Growth Improves: Southeast Asia
India and Indonesia have experienced large stock market declines and currency devaluations recently. The Malaysian Ringgit has declines 10% against the US $ in the last 3 months. Malaysia is holding up ok, but is venerable as these international loses of confidence often sweep over countries (and move from country to country).
There is a real risk that the current account could slip into a deficit for the first time since the fourth quarter of 1997, Macquarie Group Ltd. analysts said in a report this month.
“We are aware of this situation and we are aware of some of the measures to be undertaken to make sure that Malaysia remains in a surplus position,” Abdul Wahid said, without elaborating on the steps. “It is still a surplus and we are managing it.”
The surplus is narrowing on increased overseas investment and property buying, higher imports for infrastructure projects, lower palm oil and rubber export prices and the acquisition of new aircraft by Malaysian Airline System Bhd., the minister said.
The main foreign exchange earner recently seems to be selling property, that isn’t a good way to be earning foreign currency (selling assets). It is ok to do this to some extent, but relying on large inflows this way is very risky (and self defeating over the long term if it is too large). Even though palm oil and rubber exports are declining a bit, I believe they are still strong sources of foreign currency so that is good.

Chart showing loan delinquency rates from 2001-2011. It shows seasonally adjusted data for all banks for consumer and real estate loans. The chart is available for use with attribution. Data from the Federal Reserve.
2011 saw delinquency rates for loans fall across the board in the USA. Residential real estate delinquency rates fell just 25 basis points (to a still extremely large 9.86%). Commercial real estate delinquency rates fell an impressive 186 basis points (to a still high 6.12%). Credit card delinquency rates fell 86 basis points to a 17 year low, 3.27%.
The job market continues to struggle, though it is doing fairly well the last few months. The serious long term problems created by governments spending beyond their means (for decades) and allowing too big to fail institutions to destroy economic wealth and create great risk to the economy are not easy to solve: and we made no progress in doing so in 2011. The reduction in delinquency rates is a good sign for the economy. The residential real estate delinquency rates are still far too high as is government debt. And the failure to address the too big to fail (big donors to the politicians) is continuing to cause great damage to the economy.
We need to reduce consumer and government debt. Many corporations are actually flush with cash, so at least we don’t have a huge corporate debt problem. Reducing debt load will decrease risks to the economy and provide wealth for consumers to tap as they move into retirement. The too-big-to-fail big political donors like to keep policies in place that encourage too much debt and favor complex financial instruments that they take huge fees from and then let the government deal with the aftermath. The politicians continued favors to too-big-to-fail institutions is very damaging to out economic well being.
Across the board, the wealthy economies are facing a rapidly aging population (the USA is actually acing this at a much slower rate than most other rich countries – which is helpful).
Related: Consumer and Real Estate Loan Delinquency Rates 2000-2011 – Real Estate and Consumer Loan Delinquency Rates 1998-2009 – Government Debt as Percent of GDP 1998-2010 for OECD