The decisions over the past 30 years to pass huge huge tax bills to those in the future is unsustainable. Saying you cut taxes when all you actually do is postpone them is dishonest. However, many people go along with such false statements so politicians have learned to buy votes today by raising taxes on the future. Since the public keeps voting for such people when the facts are clear the only explanation is they support raising taxes, not today, but in the future (or, I suppose, they are not able to understand the clear implications of what they vote for). The Long-Term Budget Outlook
…
For decades, spending on Medicare and Medicaid has been growing faster than the economy. CBO projects that if current laws do not change, federal spending on Medicare and Medicaid combined will grow from roughly 5 percent of GDP today to almost 10 percent by 2035. By 2080, the government would be spending almost as much, as a share of the economy, on just its two major health care programs as it has spent on all of its programs and services in recent years.
…
CBO projects that Social Security spending will increase from less than 5 percent of GDP today to about 6 percent in 2035 and then roughly stabilize at that level.
…
Federal interest payments already amount to more than 1 percent of GDP; unless current law changes, that share would rise to 2.5 percent by 2020.
The cost of paying for a dysfunctional medical system has been a huge drain on the USA economy for decades. But that is nothing compared to what the future holds if we don’t adopted sensible strategies that reduce the huge extra costs we pay and the worse performance we receive for that cost.
Social security is not the huge problem many think it is. Still I would support reducing the payout to wealthy individuals and bringing the age limits more in line with the changes in life expectancy. 12.4% of pay for low and middle wage workers (high income earners stop paying social security taxes so in effect marginal tax rates decrease by 12% for any income above $106,800). Medicare taxes add 2.9% bringing the total social security and Medicare taxes to 15.1% (including both the amount paid directly by the employee and the amount paid for the employee by the employer).
Related: True Level of USA Federal Deficit – USA Federal Debt Now $516,348 Per Household – quotations about economics – articles on improving the health care system – USA Spent $2.2 Trillion, 16.2% of GDP, on Health Care in 2007
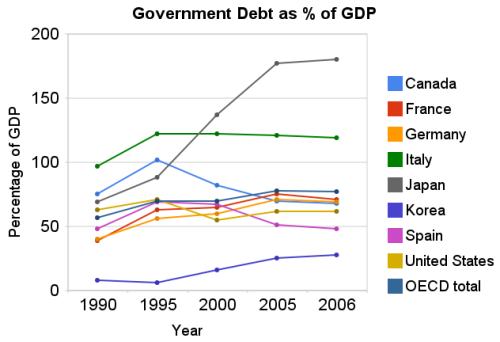 Chart showing government debt as a percentage of GDP by Curious Cat Investing Economics Blog, Creative Commons Attribution, data from OECD, March 2009.
The USA federal government debt is far too large, in my opinion. We have been raising taxes on future taxpayers for several decades, to finance our current spending. Within reason deficit spending is fine. What that reasonable level is however, is not easy to know. One big problem with the past few decades is that during very prosperous economic times we spent money that we didn’t have, choosing to raise taxes on the future (instead of either not spending as much or paying for what we were spending by raising taxes to pay for current spending).
By not even paying for what we are spending when times were prosperous we put ourselves in a bad situation when we have poor economic conditions – like today. If we were responsible during good economic times (and at least paid for what we spent) we could have reduced our debt as a percentage of GDP. Even if we did not pay down debt, just by not increasing the outstanding debt while the economy grew the ratio of debt to GDP would decline. Then when times were bad, we could afford to run deficits and perhaps bring the debt level up to some reasonable level (maybe 40% of GDP – though it is hard to know what the target should be, 40% seems within the realm of reason to me, for now).
There is at least one more point to remember, the figures in the chart are based on reported debt. The USA has huge liabilities that are not accounted for. So you must remember that the actually debt is much higher than reported in the official debt calculation.
Now on to the good news. As bad as the USA has been at spending tomorrows increases in taxes today, compared to the OECD countries we are actually better than average. The OECD is made up of countries in Europe, the USA, Japan, Korea, Australia, New Zealand and Canada. The chart shows the percentage of GDP that government debt represents for various countries. The USA ended 2006 at 62% while the overall OECD total is 77%. In 1990 the USA was at 63% and the OECD was at 57%. Japan is the line way at the top with a 2006 total of 180% (that is a big problem for them). Korea is in the best shape at just a 28% total in 2006 but that is an increase from just 8% in 1990.
Related: Federal Deficit To Double This Year – Politicians Again Raising Taxes On Your Children – True Level of USA Federal Deficit – Who Will Buy All the USA’s Debt? – Top 12 Manufacturing Countries in 2007 – Oil Consumption by Country
Read more
The economy has structural problems. The solution at this time is not to convince people that everything is fine and just go spend money you don’t have. Personal debt is much to high. The practices that allowed huge anti-competitive and economy endangering institutions to threaten the economy have not been addressed. Hundreds of billions of dollars have been given to those who caused the credit crisis. Making the federal debt problem even worse.
Some suggest we need to regain consumer confidence. Unfortunately that fixes nothing. That “strategy” is just to convince people problems don’t exist and buying what you can’t afford is fine. Just convince people to go spend more money, run up their credit card debt, borrow against their house, as long as everyone believes it can continue. That can work for awhile but it then fails due to structural issues. And the solution becomes more and more difficult the longer such a strategy is used. The same way a ponzi scheme eventually implodes.
If you could convince those in a ponzi scheme (and new investors) that they should just be optimistic it can continue. But eventually people ask for their money to buy something and none exists and the scheme fails.
With an economy, after structural problems are addressed then you need to convince people to be less fearful and to be more optimistic. Because often by that time people have become so fearful that they are not taking even reasonable steps. They don’t buy even though they have the money in the bank and have a real need for the purchase. When this happens, convincing people that the economy is stable is important. However, cheerleading and convincing people to just continue to run up their debts to spend more is not wise when the economy is already far to in debt is not wise (though it is politically expedient).
The USA needs to stop living beyond its means. That is the most important factor to long term economic strength. But the focus doesn’t seem to be on doing this, instead it seems to be on printing money to paper over the problems. There are many great strengths of the economy and those have allowed huge federal deficits, huge personal debt, monopolistic practices, destabilizing financial risks taking… Even with that things have been quite good. But those areas need to be addressed over the long term.
Related: Let the Good Times Roll (using Credit) – Families Shouldn’t Finance Everyday Purchases on Credit – Living on Less
Who Will Buy All the USA’s Debt? That is a question worth thinking about. The USA is a huge net borrower. The government can’t borrow from consumers because they are hugely in debt themselves. Over the last few decades huge investments from Japan, China and the Middle East in USA government debt have allowed the huge amount of federal debt to continue to grow rapidly. But who is going to buy the increasing amounts of debt; in the next few years, and the next few decades?
China is right to have doubts about who will buy all America’s debt
…
The other area of concern for China is the value of its Treasuries. Given the US borrowing requirement and its lax monetary policy, Treasury bond yields could well rise sharply, causing a corresponding price decline. If China’s holdings match Treasuries’ average 48-month duration, then a 5pc rise in yields, from 1.72pc on the 5-year note to 6.72pc, would lose China 17.5pc of its holdings’ value, or $119bn.
Foreign buyers have absorbed a little over $200bn of Treasuries annually, a useful contribution to financing the $459bn 2008 deficit, but only a modest help towards the $1.35 trillion minimum average deficit forecast for 2009 and 2010.
Unless that changes substantially, there will be $1 trillion annually to be raised by the Treasury from domestic sources, more than double the previous record from domestic and foreign sources together, plus whatever is needed to bail out the banks.
Even if the US savings rate were to rise from zero to its long-term average of 8% of disposable personal income, that would create only an additional $830bn of savings — not enough to fund the domestic share of the deficit. Interest rates would probably have to rise substantially to pull in more foreign investors.
Very true. Anyone buying government debt at these rates has reason to question the wisdom of doing so. Exporters to the USA have macro-economic reasons for buying debt (to keep the value of the dollar from collapsing) but the investing reasons for buying USA debt I find very questionable (I wouldn’t be buying it as an investment, if I were them).
Related: Personal Saving and Personal Debt in the USA – Americans are Drowning in Debt – USA Federal Debt Now $516,348 Per Household – Is the USA Broke?
Continuation of: USA Manufacturing is Healthy
The real problem with the USA economy is that a country cannot live beyond its means forever. Those living in USA have consumed far more than they have produced for decades. That is not sustainable. The living beyond our means is mainly due to massively increased consumption, not shrinking output (in manufacturing or service). One, of many examples, of the increased consumption is average square footage of single-family homes in the USA: 1950 – 983; 1970 – 1,500; 1990 – 2,080; 2004 – 2,349.
In case it isn’t totally obvious to you. You don’t fix this problem by encouraging more spending and borrowing: either by the government or by consumers. The long term problem for the USA economy is that people have consuming more than they have been producing. Personally, as this continues you reach a point where getting another credit card does not work. The same holds true for the collective health of a country. A country cannot solve the problem of having bills come due from decades of living beyond its means by charging more so that they can continue to live beyond their means.
Where the USA is in the continuum, is hard for me to judge. For the sack of illustration, lets say a consumer can get to 10 cards before they finally fail. If the consumer reaches the limit on 2 credit cards they have the choice to continue to the party by getting another credit card. Or they have the choice of addressing the situation they have gotten themselves into. If they decide to become responsible they have a challenge but one they can endure with some hardships.
If they press on to 5 credit cards and then max them out they come to the same decision. Dig themselves deeper in debt to avoid the problem today or live up their past behavior and become responsible. The work they have ahead of themselves is much more challenging than if they had started working on the problem when they only had 2 cards.
If they press on to 9 cards and now have the decision again. The effort to find a solution may be almost impossible. Borrow more to pay for past mistakes while maintaining some expenditures may be possible (but they will have to live on less than they earn). By the time you are this far down the failed path you have so much going to pay for your past bills you can’t spend even close to what you currently earn on current expenses. Letting yourself get to this point is very bad. And most likely as a person you will go bankrupt.
Read more
The USA national debt decreased almost $1 billion yesterday. If it decreased by $1 billion dollars a day in just 10,526 days the USA government would be out of debt. That is just under 29 years, that doesn’t seem so bad. Unfortunately the decrease yesterday is not likely the start of a new trend (it is just daily variation).
In the last month the debt is up over $580 Billion. At that rate, well lets just say if that rate continued long we would be in even more serious trouble than we have been placed in by the amazingly irresponsible behavior of the politicians increasing taxes on our grandchildren (with massive spending they chose to fund by huge tax increases on our grandchildren) have been doing the last 5 years. In the last year they have spent $1.46 Trillion more than they paid for (which will have to be paid for by future taxes – although the recent decision to purchase $125 billion in bank stocks perhaps opens another option for the the government to start buying companies and use profits they make to pay off the debt they are taking on).
The current debt stands at $10,525,823,144,117. That is a bit over $10.5 Trillion.
Related: True Level of USA Federal Deficit – USA Federal Debt Now $516,348 Per Household – Washington Paying Out Money it Doesn’t Have
What’s the real federal deficit? by Dennis Cauchon, 2006
…
The audited financial statement – prepared by the Treasury Department – reveals a federal government in far worse financial shape than official budget reports indicate, a USA Today analysis found. The government has run a deficit of $2.9 trillion since 1997, according to the audited number. The official deficit since then is just $729 billion.
…
The new Medicare prescription-drug benefit alone would have added $8 trillion to the government’s audited deficit. That’s the amount the government would need today, set aside and earning interest, to pay for the tens of trillions of dollars the benefit will cost in future years.
Standard accounting concepts say that $8 trillion should be reported as an expense. Combined with other new liabilities and operating losses, the government would have reported an $11 trillion deficit in 2004 – about the size of the nation’s entire economy.
The federal government also would have had a $12.7 trillion deficit in 2000 because that was the first year that Social Security and Medicare reported broader measures of the programs’ unfunded liabilities. That created a one-time expense.
The continued attempts by politicians to distract from the huge taxes they are voting to place on our children and grandchildren is disheartening. And the continued actions that are the equivilent of getting another credit card when they spend so much that even the “official” books that they have exceeded the allowable total federal debt that is damaging the economy. They need to learn how to live within the current taxes they collect just as people need to learn to live within their earning. Either that fails to do so mortgages their future.
Related: Politicians Again Raising Taxes On Your Children – USA Federal Debt Now $516,348 Per Household – Washington’s Funny Accounting – Lobbyists Keep Tax Off Billion Dollar Private Equities Deals and On For Our Grandchildren – Failed Leadership: Estate Tax Repeal
I think a country that is more than $500,000 in debt per household should not send out checks to taxpayers to try pretend they are doing something to help the economy. Just as I wouldn’t think some family with $20,000 in credit card debt should fix the problem by taking the family on a new credit card financed vacation. But if you are going to do so, then take Dan Ariely’s advice: Stimulus options should be tested first. His blog post on the topic, Do we know enough to give stimulus packages?
The next question, of course, is which delivery method to select. Here behavioral economics has been instructive as well. In particular, years of research have demonstrated over and over that our intuitions about the relative effectiveness of different approaches are often wrong. Given that the method of delivery could make a large difference, and given that our intuitions about their relative effectiveness could be wrong, what should we do?
One answer is to conduct an experiment, as this is the only method we have for testing what really works and what is likely to fail. In the same way that we force drug companies to test the efficacy of their drugs before rolling them onto the market, shouldn’t we ask the government to first test their ideas before they invest billions of dollars of our tax money on some stimulus packages?
Related: Politicians Again Raising Taxes On Your Children – Charge It to My Kids – Google: Experiment Quickly and Often