The $1.9 trillion covid19 relief law (American Rescue Plan Act) includes large increases in health insurance subsidies in addition to the $1,400 per person payments to individuals. The law increases subsidies for 2 years.
Under the new law, nobody will have to pay more than 8.5% of their income on health insurance. The government will also pick up 100% of COBRA premiums through September. COBRA is health insurance for people who’ve lost their jobs.
“Probably about three-quarters of uninsured people in the U.S. who are citizens are going to be eligible for some sort of financial help,” said Cynthia Cox, a vice president at the Kaiser Family Foundation.
I wrote before about the fact that under the old law, based on how the subsidy worked you could lose over $5,000 in health care subsidy payments by earning just enough to no longer be eligible for the subsidy. This new law eliminates that issue (for 2 years) as health insurance costs are now subsidized so that they cost no more than 8.5% of income (instead of having a hard cut off where subsidies go to $0).

For people most people that pay for their health care themselves (instead of their employer paying) this is likely a much larger benefit than the cash payment of $1,400.
The Kaiser Family Foundation calculator lets you get a quick idea of what your approximate subsidy benefit. A 55 year old earning $55,000 would be entitled to a subsidy of $4,700 about 50% of their health insurance costs (based on the USA average). For a 50 year old the subsidy would be $2,900 or 38%. For a 60 year old the subsidy would be $6,800 or 59%. For a couple of 35 year olds and 2 children the subsidy would be $12,100 per year or 72%.
For a 35 year old couple earning $85,000 with 2 children the subsidy would be $9,600 per year or 57%. And for a 55 year old earning $85,000 the the subsidy would be $2,200 per year or 23%.
Only the family of 4 would have been eligible for any subsidies under the old law (or will be eligible after this new law expires in 2 years). And the single 55 year old earning more than $80,000 is not eligible for the $1,400 payment but would receive $2,200 as a health care subsidy.
This is a huge personal finance benefit that has not been widely discussed but will have a huge impact on people’s financial health for the next 2 years.
Early last year when studying my portfolio I decided my two biggest positions (Apple and Google – those ready the blog won’t be surprised due to my 10 stocks for 10 years posts) continued to warrant the large portion of the portfolio they held. I also decided that I would systemically sell say 1% of Apple and 2% of Alphabet a year (the Apple dividend was also paying about 1% – actually it was more then but is much less now).
That was just a long term plan that helped me think about the long term portfolio management. But that, like all investment decision, was subject to revision. As both continued to soar I decided it made sense to sell more but maintain a similar plan, just maybe selling 2% and 4% a year (or something).
Basically I still like them as investments. I still feel both companies long term prospects are excellent. I do also feel both are pretty richly valued. They certainly do not seem to be the huge bargains they were 15 years ago. At first my main reasons for slowly selling some was mainly that the portions of the portfolio were growing a bit too high. At this time, that has become even more true. But also the prices are also getting very rich. Selling at these prices seems pretty attractive.
At these prices if I sold more now and then prices decline I can have already cashed in my planned yearly sales (based on my original plan) and therefore could hold off for several years (instead of selling at those reduced prices). And if the prices continue to go up, well I still own a lot of them and so I will profit handsomely in that case.
I have a new 2nd largest holding – Sea Limited ($SE). It is a Singapore based company that I am very high on for the long term. I bought a fair amount, all in that last year. But nowhere near enough to be my second largest holding. However my originally purchases were in the $50s and $60 and today, less than a year since my first purchase, it is at $217. It is a richly valued stock but I believe the potential is still very promising I have no plans on selling any of this anytime soon. It is volatile, it is down 5% today.
It is useful to think about the long term and even to make tentative plans. But, as an investor, adjust those plans as conditions change. I see such plans as helpful thoughts and reminders, not plans to follow automatically.
I do continue to find that the existing prices in the market make finding great investments difficult. I am normally very “over-invested” in the stock market. I have been trying to reduce how over-invested I am. I am doing that a bit less successfully than I would like. But I am raising some cash. I do remain over-invested, which is fine for me, but I also am a bit more over-invested than I think is warranted. I will continue to try to raise some cash. It is a bit difficult for me as I am naturally drawn to make investments when I see available cash to invest.
Related: Retirement Portfolio Allocation for 2020 – Long Term Changes in Underlying Stock Market Valuation
In some ways investing recently has been pretty easy, anything you have bought (almost) goes up – and usually goes up a lot. But when looking for bargains to invest in, it just keeps getting more and more difficult in my opinion.
Apple’s most recent earnings report was spectacular. However, unlike when similar things happened 8 years ago, when such great news allowed you to buy a great company cheaply even after great news now Apple went from an already pricy level and added 10% to that the next day. And it has continued to go up. Apple is by far my largest holding (given how expensive it is, a fairly crazy 25%). So I do still like the company long term, but I have been selling a bit the last year (though not nearly enough to keep it from dominating my portfolio more and more).
Years ago it was easy for me to buy Apple and be very confident I would do very well over the next 5 to 10 years. Now I am more hopeful than confident. And one reason why I continue to hold so much is I don’t see other great buys.
In the last 6 months I did make a big buy of Sea Limited ($SE) a company based in Singapore with large gaming, internet commerce and emoney interests. They are especially focused on South East Asia. I bought a lot of this quickly and that has proved wise (at least so far). I made it my 3rd largest holding (Alphabet is 2nd) very quickly and I am up over 100% already. It is speculative. But given my options it seemed like a great opportunity. I would have been much slower to increase the size of this position if I had other options I really liked.
Overall I am going much more into cash as a safe haven than I have before. Normally I am extremely overweight stocks. Even today I am still overweight stocks compared to the conventional wisdom (and the only bonds I hold are Series I USA Savings Bonds (which are actually a good investment option, though you are limited to buying $10,000 per year).
While the markets are giving investors great returns finding good buys is becoming more and more difficult (at least for me). For example, my 10 Stocks for 10 Years (2018 version) has done very well. But several of those stocks are much less a bargain today that they were. Apple is up from $225 to $450. Danaher from $103 to $206. Amazon from $2,000 to $3,150. Tencent from $43 to $68. Alibaba from $175 to $256. The only stock down is Abbvie, from $97 to $95 (though with dividends, it yields 5% now, it is up a small bit). Abbive seems like the rare bargain to me today. While there are short term risks Tencent and Alibaba also seem to be priced reasonably and offer good long term potential.
I think, my post, Long Term Changes in Underlying Stock Market Valuation, provides insight into the challenges of consistently finding the type of values today than was possible in previous decades.
Related: Investment Options Are Much Less Comforting Than Normal These Days (2013) – Retirement Portfolio Allocation for 2020 – Tucows: Building 3 Businesses With Strong Positive Cash Flow
There are many problems with the extremely low interest rates available in decade since the too-big-to-fail financial crisis. The interest rates seem to me to be artificially sustained by massive central bank actions for 12 years now.
Extraordinarily low rates encourage businesses to borrow money, after all how hard is it to invest in something that will return the business more than a few percent a year (that they can borrow at). Along with the continued efforts by the central banks to flood the economy with money any time there is even a slowdown in growth teaches companies to not worry about building a business that can survive bad times. Just borrow and if necessary borrow more if you are having trouble then just borrow more.
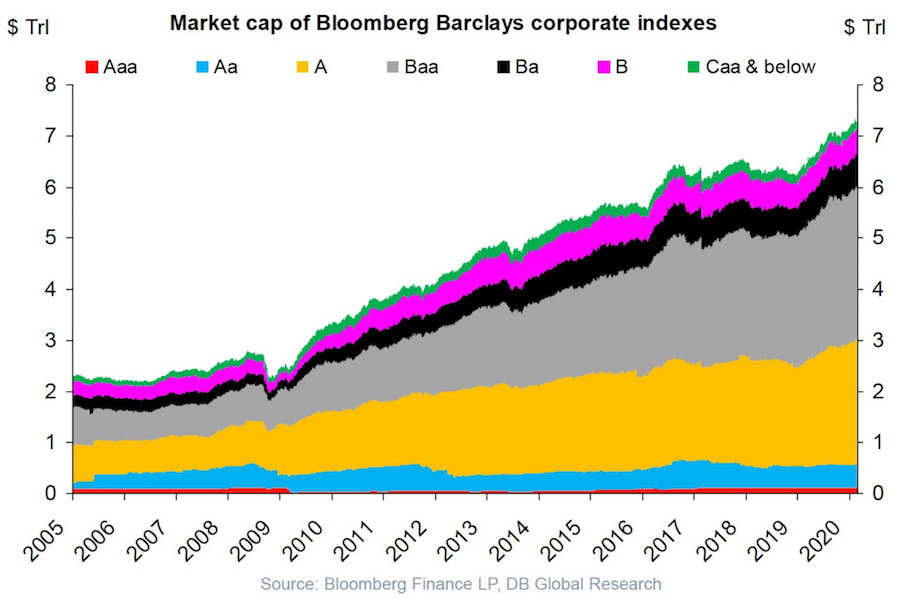
USA corporate debt has increased from a bit over $2 trillion in 2005 to over $7 trillion in 2020.
This isn’t a healthy way to build an economy. Businesses should be robust and able to sustain themselves if the economy experiences a recession and interest rates rise and the ability to borrow decreases.
Extremely low interest rates hide a huge potential cost if interest rates rise. Sure the huge debt is covered by cash flow in good times with the interest rate on your debt is 4%. What happens if interest rates rise to 6% and the economy declines? At some point investors (and banks) are going to realize that huge debt burdens on companies that are overly leveraged are not safe and deserve a premium interest rate.
I don’t think there is any risk to companies with very strong balance sheets and a business model that won’t have any trouble maintaining positive cash flow in a significant recession (Apple, Abbvie, Google, Costco, etc.). But many businesses are over-leveraged and at a significant risk of default in a bad economy.
The stock market is down quite a bit today partially due to the worry that the leveraged oil shale companies in the USA will go under if OPEC does not manage to restrict the supply of oil in order to keep oil prices high (or at least keep oil prices from collapsing).
Plenty of leveraged buyouts (where private equity firms take out cash and leave behind barely functional businesses) are barely able to survive even with extremely low interest rates. Those companies are in danger of failing when they experience even a small problems.
The markets continue to provide difficult options to investors. In the typical market conditions of the last 50 years I think a sensible portfolio allocation was not that challenging to pick. I would choose a bit more in stocks than bonds than the commonly accepted strategy. And I would choose to put a bit more overseas and in real estate.
But if that wasn’t done and even something like 60% stocks and 40% bonds were chosen it would seem reasonable (or 60% stocks 25% bonds and 15% money market – I really prefer a substantial cushion in cash in retirement). Retirement planning is fairly complex and many adjustments are wise for an individual’s particular situation (so keep in mind this post is meant to discuss general conditions today and not suggest what is right for any specific person).
I wrote about Retirement Savings Allocation for 2010: 5% real estate, 35% global stocks, 5% money market, 55% USA stocks. This was when I was young and accumulating my retirement portfolio.
Today, investment conditions make investing in retirement more difficult than normal. With interest rates so low bonds provide little yield and have increased risk (due to how much long term bond prices would fall if interest rates rise, given how low interest rates are today). And with stocks so highly valued the likelihood of poor long term returns at these levels seems higher than normal.
So the 2 options for the simplest version of portfolio allocation are less attractive than usual, provide lower income than usual and have great risk of decline than usual. That isn’t a good situation.

View of Glacier National Park (a nice place to go in retirement, or before retirement) by John Hunter
I do think looking for dividend stocks to provide some current yield in this situation makes sense. And in so doing substitute them for a portion of the bond portfolio. This strategy isn’t without risk, but given the current markets I think it makes sense.
I have always thought including real estate as part of a portfolio was wise. It makes even more sense today. In the past Real Estate Investment Trusts (REITs) were very underrepresented in the S&P 500 index, in 2016 and 2017 quite a few REITs were added. This is useful to provide some investing in REITs for those who rely on the S&P 500 index funds for their stock investments. Still I would include REIT investments above and beyond their portion of the S&P 500 index. REITs also provide higher yields than most stocks and bonds today so they help provide current income.
While I am worried about the high valuations of stocks today I don’t see much option but to stay heavily invested in stocks. I generally am very overweight stocks in my portfolio allocation. I do think it makes sense to reduce how overweight in stocks my portfolio is (and how overweight I think is sensible in general).
Tencent is one of the stocks in my 10 stocks for 10 years portfolio. In fact it is my largest holding (when you consider that Tencent shares owned by Naspers. Some others have performed better since my reboot of the portfolio in August of 2018: Apple (from 225 to 318) and Danaher (from 103 to 162) and Naspers (33 to 34, which might not seem so great but 2 spinoffs provide another 15) but I still like Tencent a great deal for the next 8 to 10 years.
Tencent has quite a few huge global businesses. One of the most promising areas is Tencent Gaming. Tencent has ownership in many of the largest computer gaming companies globally.

image by Fredrick Tendong
Tencent’s ownership share in Gaming companies
- Tencent Games – Honor of Kings (Arena of Valor outside of China) and esports leagues
- Riot Games (100%) – League of Legends and esports leagues
- Supercell (84%) – Clash of Clans, Clash Royale, and Brawl Stars
- Epic Games (40%) – Fortnite and Unreal Engine (gaming engine used to create many games)
- Activision Blizzard (5%) – Call of Duty, World of Warcraft, StarCraft, Diablo, Hearthstone, Heroes of the Storm, Overwatch, Guitar Hero and Candy Crush. They are also involved with esports. (Activision Blizzard is a public company in the USA valued at $46 billion)
- Ubisoft (5%) – Assassin’s Creed, Far Cry, Just Dance and Prince of Persia. (public French company worth $8.7 billion)
- Grinding Gear Games (80%) – Path of Exile
- Glu Mobile (14%) – many smaller games (public USA company valued at $915 million)
- Bluehole (12%) – PlayerUnknown’s Battlegrounds
- Paradox Interactive (5%) – Stellaris, Europa Universalis, Hearts of Iron, Crusader Kings, Cities: Skylines (public Swedish company valued at $1.2 billion?)
- Funcom (29%) (public Norwegian company valued at $145 million – after the stock price increased last week due to a Tencent a buyout offer)
- Sumo Digital (10%)
Tencent also have an undisclosed majority stake in Miniclip. And they own large portions of Huya and Douyu, both are big players in streaming games (similar to Twitch and YouTube Gaming).
Tencent’s subsidiary, TiMi Studios, developed Activision’s Call of Duty: Mobile.
Tencent gaming revenue struggled in 2019 due to regulatory actions in China created problems for all game publishers there. Long term global gaming revenue should continue to grow quickly and Tencent stands to be one of the best positioned companies to profit from that trend.
Read more
This post is an exploration of a specific stock Tucows (TCX). Tucows, based in Canada, has built from their domain registration business into a company with 3 businesses poised for predictable cash flow generation.
In 2012 Tucows added Ting Mobile, a business that resells access to cell phone networks (Sprint, for CDMA, and T-mobile for GSM phones). This is not a flashy business but is a reliable cash flow generator.
In 2015 they added Ting Fiber, which builds fiber networks for small communities that have long been mistreated by incumbent Internet Service Providers (ISPs – such as Comcast and AT&T). This business requires a large up front investment but once it is operating provides a large and reliable cash flow.
Tucows has leveraged the cash flow from the domain registration business to build Ting business and now is leveraging the cash from both of those businesses to build the Ting Fiber business. I believe the Ting Fiber business is going to be a long term very profitable business.
Tucows’ commitment to customer service is a way they differentiate themselves from their competitors. They provide great customer service for the Ting service (I have been a customer for years specifically due to the good customer service).
Domain Services Business
OpenSRS and Enom are Tucows’ wholesale domain name providers.
This is a fairly boring business where the key is providing reliable service at a good price. It is not a high margin business, but one that consistently generates cash for Tucows.
If you look at the domain services business you will note that sales have decreased in 2018, this is due to Tucows a large customer (that had a very low margin deal with Tucows) that transferred away a 2.7 million domains. This seems to be a good business move but it does cause investors that don’t look closely to worry. They see a decline in revenue for their domain services businesses and worry about the long term prospects.
But investors that understand that this reflects a 1 time decrease in revenue may have the potential to pick up a bargain. The remainder of the business is expected to remain, and while it isn’t expected to grow much it should continue to provide cash to be invested elsewhere by Tucows.
Ting Mobile
Ting Mobile provides cell phone plans for as little at $10 a month. The charges are based off usage and are calculated based on the actual usage each month. For those that do not frequently use the data plans on their phones or have very high minutes of usage they are much cheaper than traditional plans. The average Ting Mobile subscriber bill is $23 (from Nov 2018 Tucows Investor presentation).
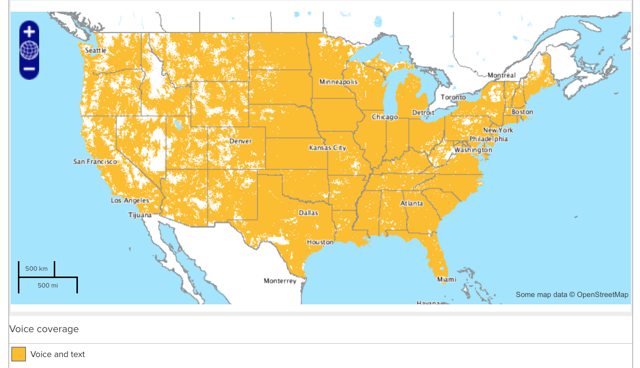
Ting coverage map
I don’t think they are competitive in prices for those that are heavy users of their smart phones. The image shows the phone call and text coverage map for CDMA devices on the Ting Mobile network.
So many companies market as though they care about customers yet they almost all treat customers very poorly. Ting is one the very few exceptions I have seen to that rule (Trader Joe’s is another).
This post lists the 20 publicly traded companies with the largest market capitalization as of today. Since my November 2017 list of the 20 most valuable stocks the value of 2 companies increased by more than $150 billion and 4 companies value decreased by over $100 billion.
In the 20 most valuable companies list there are 13 USA companies, 4 Chinese companies and 1 each for Korea, Netherlands and Switzerland. The remaining 15 companies with market caps above $200 billion are based in: USA 10, China 2, Switzerland 2 and Japan 1.
| Company | Country | Market Capitalization | |
|---|---|---|---|
| 1 | Amazon | USA | $802 billion |
| 2 | Microsoft | USA | $789 billion |
| 3 | Alphabet (GOOGL) | USA | $737 billion |
| 4 | Apple | USA | $720 billion |
| 5 | Berkshire Hathaway | USA | $482 billion |
| 6 | USA | $413 billion | |
| 7 | Tencent | China | $404 billion* |
| 8 | Alibaba | China | $392 billion |
| 9 | Johnson & Johnson | USA | $348 billion |
| 10 | China Unicom | China | $333 billion |
Amazon soared $220 billion since my November 2017 post and became the most valuable company in the world. Microsoft soared $147 billion and became the most valuable company in the world briefly before Amazon took the crown.
Apple lost $178 billion since my November 2017 post (after passing $1 trillion in market capitalization during 2018, up $100 billion from the November 2017 total, before declining). Facebook lost $118 billion off their market cap. Tencent lost $104 billion and Alibaba lost $100 billion in value during the same period.
Google increased 8 billion (since my November 2017 post).
The next ten most valuable companies:
| Company | Country | Market Capitalization | |
|---|---|---|---|
| 11 | JPMorgan Chase | USA | $332 billion |
| 12 | Visa | USA | $304 billion |
| 13 | Exxon Mobil | USA | $304 billion |
| 14 | Walmart | USA | $276 billion |
| 15 | Industrial & Commercial Bank of China (ICBC) | China | $270 billion* |
| 16 | Bank of America | USA | $255 billion |
| 17 | Nestle | Switzerland | $255 billion |
| 18 | Royal Dutch Shell | Netherlands | $250 billion |
| 19 | Pfizer | USA | $249 billion |
| 20 | Samsung | Korea | $240 billion |
Market capitalization shown are of the close of business November 26th, as shown on Google Finance.
Pfizer is the only new company in the top 20, growing by $37 billion to reach $249 billion and take the 19th spot (Wells Fargo dropped out of the top 20 and into 25th place).
Related: Global Stock Market Capitalization from 2000 to 2012 – Stock Market Capitalization by Country from 1990 to 2010 – Historical Stock Returns
Between $255 billion (which earns 15th place) and $223 billion there are 13 companies with market caps very close to each other.
A few other companies of interest (based on their market capitalization):
The most popular posts on the Curious Cat Investing and Economics blog in 2018 (based on page views).
- Default Rates on Loans by Credit Score (2015)
- Stock Market Capitalization by Country from 2000 to 2016 (2017)
- Stock Market Capitalization by Country from 1990 to 2010 (2012)
- The 20 Most Valuable Companies in the World – November 2017
- USA Household Debt Jumps to Record $13.15 Trillion (2018)*
- Save What You Can, Increase Savings as You Can Do So (2012)*
- Top 10 Countries for Manufacturing Production in 2010: China, USA, Japan, Germany… (posted in 2011)
- Government Debt as Percentage of GDP 1990-2009: USA, Japan, Germany, China… (2010)
- Manufacturing Output as a Percent of GDP by Country (1980 to 2008) (2010)
- “Explaining” Random Variation in Financial Data (2018)*
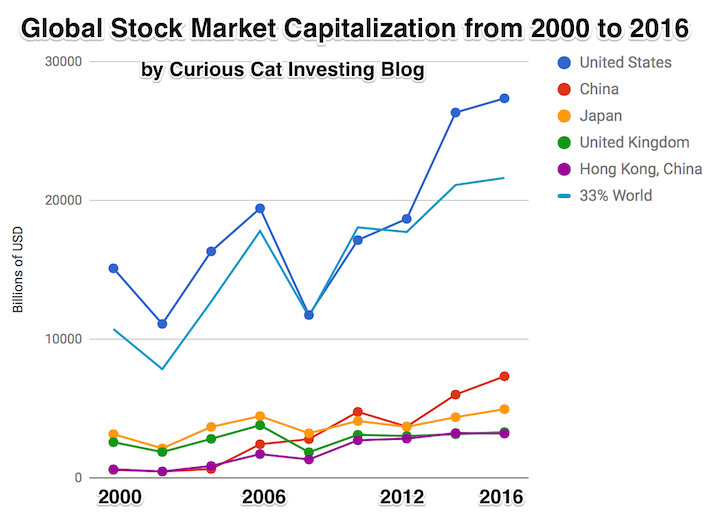
The chart shows the top countries based on stock market capitalization, with data from 2000 to 2016. The chart was created by Curious Cat Investing and Economics Blog may be used with attribution. Data from the World Bank.
When 2 year US government bonds yield more than the 10 year US government bonds a recession is likely to appear soon. This chart shows why this is seen as such a reliable predictor.
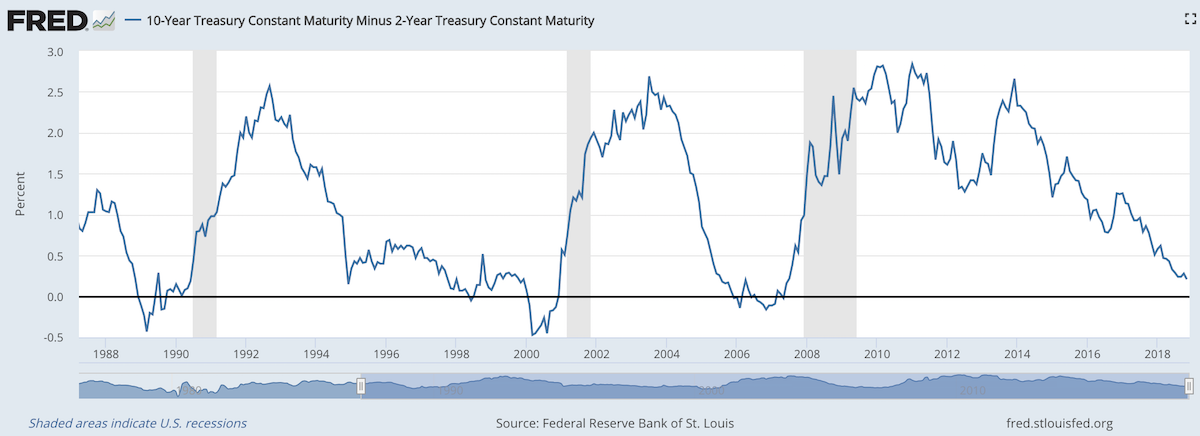
The chart shows the 10 year yield minus the 2 year yield. So when the value falls below 0 that means the 2 year yield is higher. Each time that happened, since 1988, a recession has followed (the grey shaded areas in the chart).
Do note that there were very small inversions in 1998 and 2006 that did not result in a recession in the near term. Also note that in every case the yield curve was no longer inverted by the time a recession actually started.
The reason why this phenomenon is getting so much attention recently is another thing that is apparent when looking at this chart, the 2 and 10 year yields are getting close to equal. But you can also see we are no closer than 1994 and the USA economy held off a recession for 7 more years.
Since 1970 the average length of time from the inversion of the 10 to 2 year yield curve has been 12 months (with a low of 6 months in 1973 and a high of 17 months, before the great recession of 2008).
In addition to a possibly impending yield curve inversion it has been a long time since the last recession which makes many investors and economists nervous that one may be due.
Related: 30 Year Fixed Mortgage Rates are not correlated with the Fed Funds Rate – Bond Yields Stay Very Low, Treasury Yields Drop Even More (2010) – Looking for Dividend Stocks in the Current Extremely Low Interest Rate Environment (2011) – Stock Market Capitalization by Country from 2000 to 2016
Another thing to note about yield curves at this time is that the US Federal Reserve continues to hold an enormous amount of long term government debt (trillions of dollars) which it has never done before the credit crisis of 2008. This reduces the long term yield since if they sold those assets that would add a huge amount of supply. How this impacts the predictive value of this measure will have to be seen. Also, one way for the Fed to delay the inversion would be to sell some of those bonds and drive up long term rates.