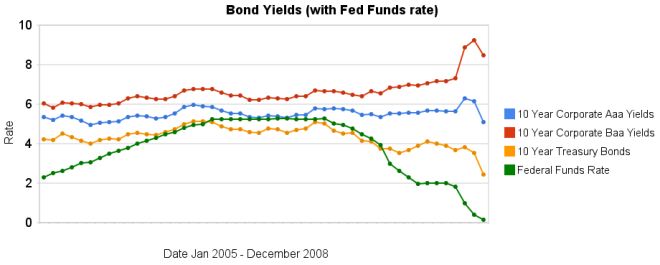
The recent reactions to the credit and financial crisis have been dramatic. The federal funds rate has been reduced to almost 0. The increase in the spread between government bonds and corporate bonds has been dramatic also. In the last 3 months the yields on Baa corporate bonds have increased significantly while treasury bond yields have decreased significantly. Aaa bond yields have decreased but not dramatically (57 basis points), well at least not compared to the other swings.
The spread between 10 year Aaa corporate bond yields and 10 year government bonds increased to 266 basis points. In January, 2008 the spread was 159 points. The larger the spread the more people demand in interest, to compensate for the increased risk. The spread between government bonds and Baa corporate bonds increased to 604 basis points, the spread was 280 basis point in January, and 362 basis points in September.
When looking for why mortgage rates have fallen so far recently look at the 10 year treasury bond rate (which has fallen 127 basis points in the last 3 months). The rate is far more closely correlated to mortgage rates than the federal funds rate is.
Data from the federal reserve – corporate Aaa – corporate Baa – ten year treasury – fed funds
Related: Corporate and Government Bond Rates Graph (Oct 2008) – Corporate and Government Bond Yields 2005-2008 (April 2008) – 30 Year Fixed Mortgage Rates versus the Fed Funds Rate – posts on interest rates – investing and economic charts
Comments
3 Comments so far
I noted with interest your article: http://investing.curiouscatblog.net/2009/01/07/chart-shows-wild-swings-in-bond-yields/
Do know where I can get historical charts for corporate bonds, 10 year AA rated and 10 year BBB rated? I’m investing in bonds and would like to know how the rates have changed for the ratings/maturities I’m interested in. Most data/charts I’ve seen on only for today’s data and any charts have been using Moody’s “composite/average maturity” bonds not specifically 10 years. You do not buy a “composite/average” maturity.
[…] Bond Yields Change Little Over Previous Months (December 2009) – Chart Shows Wild Swings in Bond Yields in Late 2008 – Real Estate and Consumer Loan Delinquency Rates 1998-2009 – Government Debt as […]
[…] 6 Months (April 2010) – Bond Yields Change Little Over Previous Months (December 2009) – Chart Shows Wild Swings in Bond Yields in Late 2008 – Government Debt as Percentage of GDP 1990-2009 in USA, Japan, Germany, China… November […]