There are many problems with the extremely low interest rates available in decade since the too-big-to-fail financial crisis. The interest rates seem to me to be artificially sustained by massive central bank actions for 12 years now.
Extraordinarily low rates encourage businesses to borrow money, after all how hard is it to invest in something that will return the business more than a few percent a year (that they can borrow at). Along with the continued efforts by the central banks to flood the economy with money any time there is even a slowdown in growth teaches companies to not worry about building a business that can survive bad times. Just borrow and if necessary borrow more if you are having trouble then just borrow more.
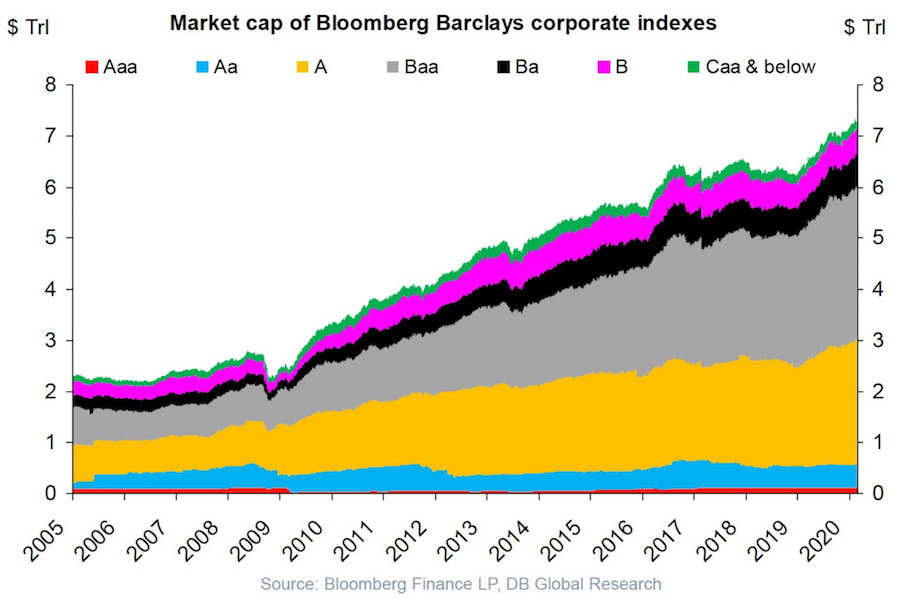
USA corporate debt has increased from a bit over $2 trillion in 2005 to over $7 trillion in 2020.
This isn’t a healthy way to build an economy. Businesses should be robust and able to sustain themselves if the economy experiences a recession and interest rates rise and the ability to borrow decreases.
Extremely low interest rates hide a huge potential cost if interest rates rise. Sure the huge debt is covered by cash flow in good times with the interest rate on your debt is 4%. What happens if interest rates rise to 6% and the economy declines? At some point investors (and banks) are going to realize that huge debt burdens on companies that are overly leveraged are not safe and deserve a premium interest rate.
I don’t think there is any risk to companies with very strong balance sheets and a business model that won’t have any trouble maintaining positive cash flow in a significant recession (Apple, Abbvie, Google, Costco, etc.). But many businesses are over-leveraged and at a significant risk of default in a bad economy.
The stock market is down quite a bit today partially due to the worry that the leveraged oil shale companies in the USA will go under if OPEC does not manage to restrict the supply of oil in order to keep oil prices high (or at least keep oil prices from collapsing).
Plenty of leveraged buyouts (where private equity firms take out cash and leave behind barely functional businesses) are barely able to survive even with extremely low interest rates. Those companies are in danger of failing when they experience even a small problems.
I have decided to wind down my investment test with LendingClub. I should end up with a investment return of about 5% annually. So it beat just leaving the money in the bank. But returns are eroding more recently and the risk does not seem worth the returns.
Early on I was a bit worried by how often the loan defaulted with only 0, 1 or 2 payments made. Sure, there are going to be some defaults and sometimes in extremely unlucky situation it might happen right away. But the amount of them seems to me to indicate LendingClub fails to do an adequate job of screening loan candidates.
Over time the rates LendingClub quoted for returns declined. The charges to investors for collecting on late loans were very high. It was common to see charges 9 to 10 times higher as the investor than were charged to the person that took out the loan and made the late payment.
For the last 6 months my account balance has essentially stayed the same (bouncing within the same range of value). I stopped reinvesting the payments received from LendingClub loans several months ago and have begun withdrawing the funds back to my account. I will likely just leave the funds in cash to increase my reserves given the lack of appealing investment options (and also a desire to increase my cash position in given my personal finances now and looking forward for the next year). I may invest the funds in dividend stocks depending on what happens.
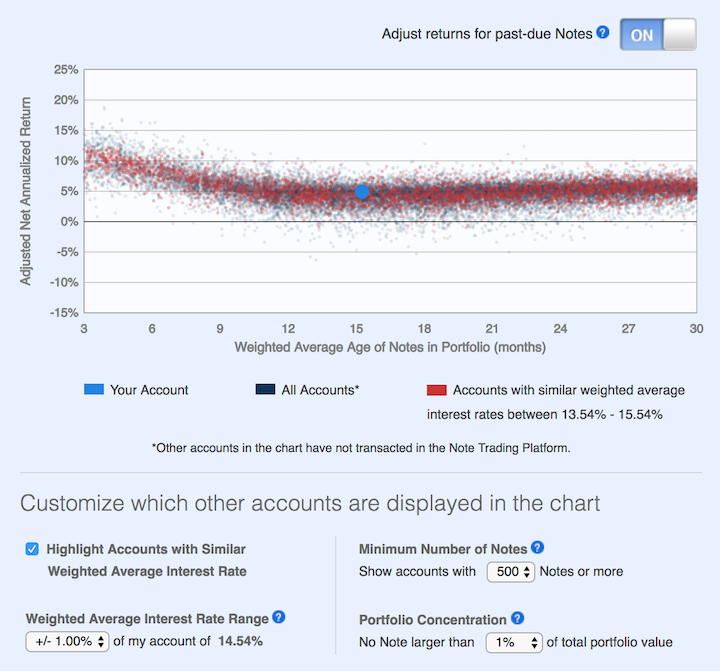
This chart shows lending club returns for portfolios similar to mine. As you can see a return of about 5% is common (which is about where I am). Quite a few more than before actually have negative returns. When I started, my recollection is that their results showed no losses for well diversified portfolios.
The two problems I see are poor underwriting quality and high costs that eat into returns. I do believe the peer to peer lending model has potential as a way to diversify investments. I think it can offer decent rates and provide some balance that would normally be in the bond portion of a portfolio allocation. I am just not sold on LendingClub’s execution for delivering on that potential good investment option. At this time I don’t see another peer to peer lending options worth exploring. I will be willing to reconsider these types of investments at a later time.
I plan to just withdraw money as payments on made on the loans I participated in through LendingClub.
Related: Peer to Peer Portfolio Returns and The Decline in Returns as Loans Age (2015) – Investing in Peer to Peer Loans – Looking for Yields in Stocks and Real Estate (2012) – Where to Invest for Yield Today (2010)
This is a continuation of my previous post: Investing in Peer to Peer Loans
LendingClub suggest a minimum of 100 loans (of equal size) to escape the risk of your luck with individual loans causing very bad results. Based on this diversity the odds of avoiding a loss have been very good (though that obviously isn’t a guarantee of future performance), quote from their website (Nov 2015):
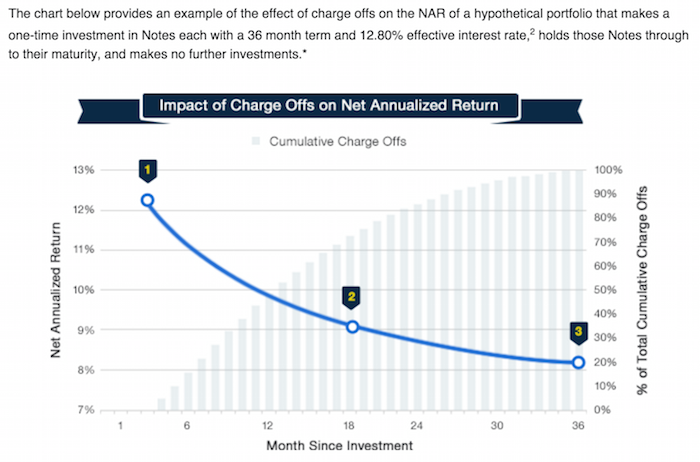
This chart, from LendingClub, shows a theoretical (not based on past performance) result. The basic idea is that as the portfolio ages, more loans will default and thus the portfolio return will decline. This contrasts with other investments (such as stocks) that will show fluctuating returns going up and down (over somewhat dramatically) over time.
For portfolios of personal loans diversity is very important to avoid the risk of getting a few loans that default destroying your portfolio return. For portfolios with fewer than 100 notes the negative returns are expected in 12.8% of the cases (obviously this is a factor of the total loans – with 99 loans it would be much less likely to be negative, with 5 it would be much more likely). I would say targeting at least 250 loans with none over .5% would be better than aiming at just 100 loans with none over 1% of portfolio.
There are several very useful sites that examine the past results of Lending Club loans and provide some suggestions for good filters to use in selecting loans. Good filters really amount to finding cases where Lending Club doesn’t do the greatest job of underwriting. So for example many say exclude loans from California to increase your portfolio return. While this may well be due to California loans being riskier really underwriting should take care of that by balancing out the risk v. return (so charging higher rates and/or being more stringent about taking such loans.
So I would expect Lending Club to adjust underwriting to take these results into account and thus make the filters go out of date. Of course this over simplifies things quite a bit. But the basic idea is that much of the value of filters is to take advantage of underwriting weaknesses.

This chart (for 36 month loans) is an extremely important one for investors in peer to peer loans. It shows the returns over the life of portfolios as the portfolio ages. And this chart (for LendingClub) shows the results for portfolios of loans issued each year. This is a critical tool to help keep track to see if underwriting quality is slipping.
Peer to peer lending has grown dramatically the last few years in the USA. The largest platforms are Lending Club (you get a $25 bonus if you sign up with this link – I don’t think I get anything?) and Prosper. I finally tried out Lending Club starting about 6 months ago. The idea is very simple, you buy fractional portions of personal loans. The loans are largely to consolidate debts and also for things such as a home improvement, major purchase, health care, etc.).
With each loan you may lend as little as $25. Lending Club (and Prosper) deal with all the underwriting, collecting payments etc.. Lending Club takes 1% of payments as a fee charged to the lenders (they also take fees from the borrowers).
Borrowers can make prepayments without penalty. Lending Club waives the 1% fee on prepayments made in the first year. This may seem a minor point, and it is really, but a bit less minor than I would have guessed. I have had 2% of loans prepaid with only an average of 3 months holding time so far – much higher than I would have guessed.
On each loan you receive the payments (less a 1% fee to Lending Club) as they are made each month. Those payments include principle and interest.

This chart shows the historical performance by grade for all issued loans that were issued 18 months or more before the last day of the most recently completed quarter. Adjusted Net Annualized Return (“Adjusted NAR”) is a cumulative, annualized measure of the return on all of the money invested in loans over the life of those loans, with an adjustment for estimated future losses. From LendingClub web site Nov 2015, see their site for updated data.
Lending Club provides you a calculated interest rate based on your actual portfolio. This is nice but it is a bit overstated in that they calculate the rate based only on invested funds. So funds that are not allocated to a loan (while they earn no interest) are not factored in to your return (though they actually reduce your return). And even once funds are allocated the actual loan can take quite some time to be issued. Some are issued within a day but also I have had many take weeks to issue (and some will fail to issue after weeks of sitting idle). I wouldn’t be surprised if Lending Club doesn’t start considering funds invested until the loan is issued (which again would inflate your reported return compared to a real return), but I am not sure how Lending Club factors it in.
European government debt has been sold at negative interest rates recently. The United States Treasury has now come as close to that as possible with 0% 3 month T-bills in the latest auction.
The incredible policies that have created such loose credit has the world so flooded with money searching for somewhere to go that 0% is seen as attractive. This excess cash is dangerous. It is a condition that makes bubbles inflate.
Low interest rates are good for businesses seeking capital to invest. These super low rates for so long are almost certainly creating much more debt for no good purpose. And likely even very bad purposes since cash is so cheap.
One thing I didn’t realize until last month was that while the USA Federal Reserve stopped pouring additional capital into the markets by buying billions of dollars in government every month they are not taking the interest and maturing securities and reducing the massive balance sheet they have. They are actually reinvesting the interest (so in fact increasing the debt load they carry) and buying more debt anytime debt instruments they hold come due.
The Fed should stop buying even more debt than they already hold. They should not reinvest income they receive. They should reduce their balance sheet by at least $1,500,000,000,000 before they consider buying new debt.
Unless the failure to address too-big-to-fail actions (and systems that allow such action) results in another great depression threat. And if that happens again they should not take action until people responsible are sitting in jail without the possibly of bail. The last bailout just resulted in transferring billions of dollars from retires and other savers to the pockets of those creating the crisis. Doing that again when we knew that was fairly likely without changing the practices of the too-big-to-fail banks. But I would guess we will just bail them out while they sit in one of the many castles their actions at the too-big-to-fail banks bought them and big showered with more cash in the bailout from the next crisis.
How to invest in these difficult times is not an easy question to answer. I would put more money in stocks for yield (real estate investment trusts, drug companies, dividend aristocrats), I would also keep cash even if it yields 0% and actually a new category for me – peer to peer lending (which I will write about soon). Recently many dividend stocks have been sold off quite a bit (and then on top of that drug stocks sold off) so they are a much better buy today than 4 months ago. Still nothing is easy in what I see as a market with much more risk than normal.
I am almost never a fan of long term debt. I would avoid it nearly completely today (if not completely). For people that are retired and living off their dividends and interest I may have some long term debt but I would have much more in cash and short term assets (even with the very low yields). Peer to peer lending has risks but given what the fed has done to savers I would take that risk to get the larger yields. The main risk I worry about is the underwriting risk – the economic risks are fairly well known, but it is very hard to tell if the lender starts doing a poor job of underwriting.
Related: The Fed Should Raise the Fed Funds Rate – Too-Big-to-Fail Bank Created Great Recession Cost Average USA Households $50,000 to $120,000 – Buffett Calls on Bank CEOs and Boards to be Held Responsible – Historical Stock Returns
The USA economy is far from strong. The global economy seems even weaker. Inflation is not an imminent risk. Under such conditions the USA Federal Reserve adding gasoline to the economy via low interest rates makes sense.
The issue I see is that a .25% Fed Funds rate is adding gasoline to the economy via low interest rates. Many people are saying an increase is like taking away the gasoline and taking out a fire extinguisher. But it really isn’t. Raising the rate to .25% is slightly decrease the amount of gas you are adding to the fire. A .25% Federal Funds rate is pouring nearly as much gas on as you are able to but not quite the absolute most you are able to.
It is also true that the Fed bailing out the too-big-to-fail bankers and banks resulted in them not only opening up the gasoline as much as possible (taking rates to 0) they even went far beyond that with new methods of pouring on gasoline that hadn’t even been considered until the bankers’ risk-taking doomed the economy (and bankrupted their institutions – without government bailouts propping them up).
The Federal Reserve has finally turned off the massive extraordinary dumping of gasoline onto the economic fire (via quantitative easing). But they have kept not only dumping lots of gasoline on the economy but doing so to the absolute maximum possible via a 0% Fed Funds rate.
Arguing for slowing the amount of fuel you are dumping into the economy is not the same as saying you are constricting the economy. We have been put into a crazy global economic condition by the too-big-to-fail bankers and the massive amounts of government and personal debt taken out. So simple analogies are not effective in making policy.
The analogies can help explain what the intent and expectation of the policy is. It is true we have created a very tenuous economic foundation (and we haven’t in any way substantial way addressed the risk too-big-to-fail bankers can throw the global economy into and we still have massive debt problems). The main beneficiaries of the central banker’s policies the last nearly 10 years are too-big-to-fail bankers and those borrowing huge amounts of money.
Those suffering from the policy are savers and I fear those that have to cope with the aftermath of this massive intervention with likely bubbles (government debt, personal debt [including education debt in the USA, etc.]). The main reason I believe rates should be raised are to begin the path to stop transferring wealth from savers to too-big-to-fail bankers and those with massive debt problems.
For the first time ever average 30 year fixed mortgage rates have fallen under 4%. My guess about interests rates have not been very good the last decade or so. I can’t believe people actually want to lend at these rates but obviously I have been wrong. The risks of lending at these rates over the long term just seem way too high to take a paltry 4%. But obviously I have been wrong.
So if you didn’t refinance when I suggested it (and refinance, myself), previously, you may want to look at doing so now. Or you may believe that listen to me about interest rates doesn’t seem very wise.
I have even read that banks are reducing fees in order to encourage refinancing. Seems crazy to me, but what do I know.
You do need to have a decent loan to value ratio (certainly no more than 90%, and probably 80% would be better). That can be difficult for those that have had large decreases in their homes value. Also you need a great credit rating and a stable job situation. But if you qualify refinancing at these rates should be a great financial move for many. I’m perfectly happen to have done so earlier, I didn’t quite pick the bottom but I still think over 30 years these rates (the current rates and earlier rates of 4 1/4% or 4 3/8%) will seem like a dream.
Related: Fixed Mortgage Rates Reach New Low (August 2010) – Lowest 30 Year Fixed Mortgage Rates in 37 Years (Dec 2008) – The Impact of Credit Scores and Jumbo Size on Mortgage Rates (Jan 2009)
Yields are staying amazingly low today. Due to the credit crisis the federal reserve is shifting hundreds of billions of dollars from savers to bankers to allow banks to make up for losses they experienced (both in losses on bad loans and huge cash payments made to hundreds of executives over more than a decade). For that reason (and others) yields are extremely low now which is a great burden on those that saved and counted on reasonable investment yield.
Don’t be fooled by apologist for those causing the credit crisis that try and excuse their behavior and act as those paying back the bailout payments means they paid back the favors they were given. They have received much more from the policies of the federal reserve that has taken hundreds of billions of dollars from savers and given it to bankers. It has the same effect as a direct tax on savers being paid to bankers.
What is an investor/saver to do? James Jubak provides some excellent advice.
How to maximize what your cash pays even when nothing is paying much of anything now
You could lock your money up for decades and get 4.56% in a 30-year Treasury bond but 30 years is forever. And besides interest rates have to go up from today’s lows and that means bond prices will be coming down, probably fast enough to eat up all the interest that bond pays and more.
…
Not if you remember that interest rates are going up in most of the world (except maybe Europe and Japan) quite dramatically over the next 12 months. A year from now, perhaps sooner, you’ll be able to get yields swell north of anything you can find now.
That pretty much means that you’re guaranteed to lose money two ways by locking it up for the long term now.
…
For the short term you need to put your cash into something that’s as safe as possible but that offers you as much income as possible—and that doesn’t lock up your money for very long.
My choice dividend paying stocks—if they pay a high dividend, are extremely liquid, and are battle tested.
Whether you agree with his suggestions in the article is up to you. But even if you don’t he provides a very good overview of the options and risks that you have to navigate now as an investor seeking investments that provide a decent yield. I agree with him that interest rates seem likely to rise, making bonds an investment I largely avoid now myself.
Related: posts on financial literacy – Jubak Picks 10 Stocks for Income Investors – S&P 500 Dividend Yield Tops Bond Yield: First Time Since 1958 – Bond Yields Show Dramatic Increase in Investor Confidence
TIPS Drive Away Biggest Bond Bulls Seeing Inflation
…
TIPS pay interest on a principal amount that rises with consumer prices. Their face value is protected against deflation, because the principal can’t fall below par. The benchmark 1.375 10-year Treasury-Inflation Protected Security due January 2020 yields 1.45 percent.
That’s 2.25 percentage points less than Treasuries of similar maturity that don’t provide protection from rising prices. The difference, known as the breakeven rate, reflects the pace of inflation investors expect over the life of the securities. The spread has fallen from the peak this year of 2.49 percentage points on Jan. 11.
I believe that the risks of inflation are so low that TIPS are not a good way to invest some of your investment portfolio. At these low rates I agree TIPS are hardly a wonderful investment but I think it is worth sacrificing some yield to gain if inflation does return in a few years. But the argument for not buying TIPS is also sensible I think.
Related: Bond Yields Show Dramatic Increase in Investor Confidence – Who Will Buy All the USA’s Debt? – Retirement Savings Allocation for 2010 – posts on bonds
I adjusted my future retirement account 401(k) allocations today. I do not have as favorable an opinion of investing in the stock market today as I did a year ago. I would likely have allocated 20% to a money market fund except my 401(k) actually has two options – 1 paying 0.0% and the other paying -.02%.
They seem to believe they should make a significant profit while providing a horrible return (they are still taking over .5% of assets in fees – even though rates do not cover their fees). Those running funds have very little interest in providing value for 401(k) participants – they are mainly interested in raising fees (though supposedly they are suppose to be run by people with a fiduciary responsibility to the investors). Unfortunately most 401(k)s lock you away from the best options for an investor (such as Vanguard Funds).
My current allocation for future funds is 40% to USA stocks, 40% to Global stocks and 20% to inflation adjusted bonds. My current allocation in this retirement account is 10% real estate, 35% global stocks, 55% USA stocks. For all my retirement savings it is probably about 5% real estate, 35% global stocks, 5% money market, 55% USA stocks (which is a fairly aggressive mix).
As I have said many times I do not like bonds at this time. I don’t think the interest nearly justifies the risk of capital loss (due to inflation or interest rate risk). Inflation protected bonds are a much more acceptable option for someone that is worried about inflation (like I am over the next 10-20 years).
A number of the stock fund (even bond fund) options in my 401(k) have expense ratios above 1%. That is unacceptable. The average fees on the options I chose were .5%.
With my employee match I am adding over 10% of my income to my 401(k), which I think is a good aim for most everyone. Far too many people are unwilling to forgo luxuries to save appropriately for their retirement. This is a sign of financial illiteracy and an unwillingness to accept the responsibilities of modern life.
Related: Investing – My Thoughts at the End of 2009 – 401(k)s are a Great Way to Save for Retirement – Saving for Retirement – Managing Retirement Investment Risks