Wells Fargo is offering to donate $1 to Kiva for every person that completes a 7 question survey (no contact information is required) to get what they call a retirement security index. I did and there are 2 benefits to doing so yourself. First, most of us would benefit from more attention to our retirement planning. Second help out Kiva – which I have mentioned many time.
Now I think their questionnaire is far too simplistic but it is hard to get people to spend even 15 minutes looking at a saving plan for retirement. So I know they are trying to keep it very simple so people will complete it. That said, read our posts on retirement planning to lean more about planning for retirement. It is critical that you spend the time in your 20’s, 30’s and 40’s doing this or you are really going to have trouble making decent retirement plans.
Related: Add to Your 401(k) and IRA – Spending Guidelines in Retirement – Retirement Savings Survey Results – Personal Finance: Saving for Retirement
Apartment Vacancy at 22-Year High in U.S.
…
Asking rents for apartments fell 0.6 percent in the second quarter from the first, Reis said. That matched the rate of change in the first quarter, the biggest drop since Reis began reporting such data in 1999.
…
New York had the lowest vacancy rate in the second quarter, at 2.9 percent, followed by New Haven, home to Yale University; Central New Jersey; New York’s Long Island; and Syracuse, New York, according to Reis.
Related: Housing Rents Falling in the USA – Rent Controls are Unwise – It’s Now a Renter’s Market – articles on investing and real estate
Short selling stock is a tool that can help keep markets more stable. However, short selling can be used to manipulate the market and in the last decade naked short selling has contributed to such manipulation. The SEC has made permanent a temporary rule that was approved in 2008 in response to continuing concerns regarding “fails to deliver” and potentially abusive “naked” short selling. In particular, temporary Rule 204T made it a violation of Regulation SHO and imposes penalties if a clearing firm:
* does not purchase or borrow shares to close-out a “fail to deliver”
* resulting from a short sale in any equity security
* by no later than the beginning of trading on the day after the fail first occurs (Trade + 4 days).
Cutting Down Failures to Deliver: An analysis conducted by the SEC’s Office of Economic Analysis, which followed the adoption of the close-out requirement of Rule 204T and the elimination of the “options market maker” exception, showed the number of “fails” declined significantly.
For example, since the fall of 2008, fails to deliver in all equity securities has decreased by approximately 57 percent and the average daily number of threshold list securities has declined from a high of approximately 582 securities in July 2008 to 63 in March 2009. Which still is not acceptable, in my opinion. In general this is a good move by the SEC, but still not sufficient.
Transparency is increased some by the SEC with the new rules:
* Daily Publication of Short Sale Volume Information. It is expected in the next few weeks that the SROs will begin publishing on their Web sites the aggregate short selling volume in each individual equity security for that day.
* Disclosure of Short Sale Transaction Information. It is expected in the next few weeks that the SROs will begin publishing on their Web sites on a one-month delayed basis information regarding individual short sale transactions in all exchange-listed equity securities.
* Twice Monthly Disclosure of Fails Data. It is expected in the next few weeks that the Commission will enhance the publication on its Web site of fails to deliver data so that fails to deliver information is provided twice per month and for all equity securities, regardless of the fails level.
Full SEC press release: SEC Takes Steps to Curtail Abusive Short Sales and Increase Market Transparency
Related: SEC Temporarily Bans Short-selling Financial Stocks – Shorting Using Inverse Funds – Too Much Leverage Killed Mervyns
I originally setup the 10 stocks for 10 years portfolio in April of 2005. In order to track performance created a marketocracy portfolio but had to make some minor adjustments (and marketocracy doesn’t allow Tesco to be purchased, though it is easily available as an ADR to anyone in the USA to buy in real life – it is based in England). The current marketocracy calculated annualized rate or return (which excludes Tesco) is 3.5% (the S&P 500 annualized return for the period is -1.7%) – marketocracy subtracts the equivalent of 2% of assets annually to simulate management fees – as though the portfolio were a mutual fund – so without that the return is about 5.5%).
The current stocks, in order of return:
| Stock | Current Return | % of sleep well portfolio now | % of the portfolio if I were buying today | |
|---|---|---|---|---|
| Amazon – AMZN | 136% | 9% | 9% | |
| Google – GOOG | 105% | 15% | 13% | |
| Templeton Dragon Fund – TDF | 80% | 11% | 11% | |
| PetroChina – PTR | 78% | 11% | 10% | |
| Templeton Emerging Market Fund – EMF | 28% | 5% | 6% | |
| Cisco – CSCO | 15% | 6% | 8% | |
| Toyota – TM | 7% | 9% | 11% | |
| Danaher – DHR | -14% | 6% | 9% | |
| Tesco – TSCDY | -14%* | 0%* | 10% | |
| Intel – INTC | -15% | 4% | 6% | |
| Pfizer – PFE | -38% | 5% | 7% | |
| Dell | -60% | 4% | 0% |
The portfolio is beating the S&P 500 by 5.2% annually (which is actually quite good. Also it is a bit confused due to to Tesco not being included. View the current marketocracy Sleep Well portfolio page.
Related: 12 Stocks for 10 Years Update – June 2008 – posts on stocks – investing books
Read more
The decisions over the past 30 years to pass huge huge tax bills to those in the future is unsustainable. Saying you cut taxes when all you actually do is postpone them is dishonest. However, many people go along with such false statements so politicians have learned to buy votes today by raising taxes on the future. Since the public keeps voting for such people when the facts are clear the only explanation is they support raising taxes, not today, but in the future (or, I suppose, they are not able to understand the clear implications of what they vote for). The Long-Term Budget Outlook
…
For decades, spending on Medicare and Medicaid has been growing faster than the economy. CBO projects that if current laws do not change, federal spending on Medicare and Medicaid combined will grow from roughly 5 percent of GDP today to almost 10 percent by 2035. By 2080, the government would be spending almost as much, as a share of the economy, on just its two major health care programs as it has spent on all of its programs and services in recent years.
…
CBO projects that Social Security spending will increase from less than 5 percent of GDP today to about 6 percent in 2035 and then roughly stabilize at that level.
…
Federal interest payments already amount to more than 1 percent of GDP; unless current law changes, that share would rise to 2.5 percent by 2020.
The cost of paying for a dysfunctional medical system has been a huge drain on the USA economy for decades. But that is nothing compared to what the future holds if we don’t adopted sensible strategies that reduce the huge extra costs we pay and the worse performance we receive for that cost.
Social security is not the huge problem many think it is. Still I would support reducing the payout to wealthy individuals and bringing the age limits more in line with the changes in life expectancy. 12.4% of pay for low and middle wage workers (high income earners stop paying social security taxes so in effect marginal tax rates decrease by 12% for any income above $106,800). Medicare taxes add 2.9% bringing the total social security and Medicare taxes to 15.1% (including both the amount paid directly by the employee and the amount paid for the employee by the employer).
Related: True Level of USA Federal Deficit – USA Federal Debt Now $516,348 Per Household – quotations about economics – articles on improving the health care system – USA Spent $2.2 Trillion, 16.2% of GDP, on Health Care in 2007
Two Professors Argue About the Invisible Hand – And Both Get it Wrong too
…
He used the term not in his discussion and analysis of markets (Book I and II of Wealth Of Nations), but in a discussion of the choice of export/importing versus investing in domestic businesses (Book IV of Wealth Of Nations on his critique of mercantile political economy). It had nothing to do with ‘regulating’.
…
It was a metaphor Smith used only three times and he never said “that when this invisible hand exists, when we all pursue our own interest, we end up promoting the public good, and often more effectively than if we had actually and directly intended to do so.” That is a modern construction placed on the metaphor and has next to nothing to do Adam Smith
…
The invisible hand was never in Adam Smith’s world in the form invented in mid-20th century by some economists who created the Chicago version of Adam Smith, while ignoring the Adam Smith born in Kirkcaldy, Scotland in 1723.
Related: There is No Invisible Hand – Myths About Adam Smith Ideas v. His Ideas – Not Understanding Capitalism
Mobius Says Derivatives, Stimulus to Spark New Crisis
“Political pressure from investment banks and all the people that make money in derivatives” will prevent adequate regulation, said Mobius, who oversees $25 billion as executive chairman of Templeton in Singapore. “Definitely we’re going to have another crisis coming down,”
…
A “very bad” crisis may emerge within five to seven years as stimulus money adds to financial volatility, Mobius said. Governments have pledged about $2 trillion in stimulus spending.
…
“Banks have lobbied hard against any changes that would make them unable to take the kind of risks they took some time ago,” said Venkatraman Anantha-Nageswaran, global chief investment officer at Bank Julius Baer & Co. in Singapore. “Regulators are not winning the battle yet and I’m not sure if they are making a strong case yet for such changes.”
Mobius also predicted a number of short, “dramatic” corrections in stock markets in the short term, saying that “a 15 to 20 percent correction is nothing when people are nervous.” Emerging-market stocks “aren’t expensive” and will continue to climb
I share this concern for those we bailed out using the money we paid them to pay politicians for more favors. Those paying our politicians like very much paying themselves extremely well and then being bailed out by the taxpayers when their business fails. They are going to try to retain the system they have in place. And they are likely to win – politicians are more likely to provide favors to those giving them large amounts of money than they are to learn about proper management of an economy.
Related: Congress Eases Bank Laws for Big Donors (1999) – Lobbyists Keep Tax Off Billion Dollar Private Equities Deals and On For Our Grandchildren – General Air Travel Taxes Subsidizing Private Plane Airports – CEOs Plundering Corporate Coffers
Welcome to the Curious Cat Investing and Economics Carnival, we hope you enjoy the following posts we share here.
- Warren Buffet On An Investment News Channel by Robin Bal – “I could see that the mere mention of a time scale like three to five years had derailed the interviewer’s thought process. Coming as she did from a world where three to five hours or at most three to five days is the standard unit of time, the idea of an investor talking in years seemed to have thrown a spanner in her works.”
- Loan Default Rates: 1998-2009 by John Hunter – “In the 4th quarter of 2007 residential real estate default rates were 3.02% by the 4th quarter of 2008 they were 6.34% and in the 1st quarter of this year they were 7.91%”
- Key Factors Affecting Long-Term Growth in Federal Spending by Douglas Elmendorf – “Two factors underlie the projected increase in federal spending on Medicare, Medicaid, and Social Security as a share of GDP: rapid growth in health care costs and an aging population.”
- Will the Chinese Keep Saving? by Rachel Ziemba – “Should export-oriented ‘surplus’ countries like China keep saving and keep trying to export demand, the reduction in imbalances could actually exacerbate the global economic contraction or contribute to a more sluggish recovery. “
- Use Your Health Insurance! by David Weliver – “So if you’re worried about losing your job (and insurance) or anticipate making a life change that will leave you uninsured, get in to see a doctor while you are still covered.”
- Where is the externality here? by Matt Nolan – “They are paid less because their marginal product is lower, and they are willing to be paid less because the benefit they receive from consuming alcohol is sufficient compensation – this is a completely internalised decision for the drinker isn’t it, so where is the social cost.”
- Quibbles With Quants – “What the models failed to capture was that humans don’t behave in simple, predictable and uncorrelated ways. It’s impossible to overstate the importance of the way these models cope with correlation of peoples’ psychology. To sum it up: they don’t. Let me know if that’s too complex an analysis for the mathematical masters of the universe.”
- Goldman’s Back, and Why We Should Be Worried by Robert Reich – “The decision to bail out AIG resulted in a $13 billion giveaway to Goldman because Goldman was an AIG counterparty. Indeed, Goldman executives and alumni have played crucial roles in guiding the Wall Street bailout from the start. So the fact that Goldman has reverted to its old ways in the market suggests it has every reason to believe it can revert to its old ways in politics, should its market strategies backfire once again — leaving the rest of us once again to pick up the pieces.”
Here is a good blog post showing one great feature of the blogosphere (that term seems to have fallen out of use hasn’t it): interaction. It also shows that you have to think critically. You can’t just accept what you read (you never can, but that is even more true with blogs than it is with newspapers that at least have some standards normally). I tend to agree with this posts look at the data, though I have not examined the issue closely.
Bad Math, Bad Statistics: Trying to get a blogger to admit a mistake
1981: 229465714 * 8476.0 = 1.944 trillion
1992: 255029699 * 14847.0 = 3.786 trillion (94% gain)
2005: 292892127 * 25036.0 = 7.332 trillion (93.6% gain)
Er, doesn’t look like a lag to me. In fact, it looks like it’s doubling every 12-13 years just as much as GDP is. I also looked up total income statistics for the US, and found the following figures (source). (Note these figures are different. More on that later.)
1981: $2,580,600,000 (2.58 / 3.1 = 83% of GDP)
1992: $5,349,384,000 (more than double!) (5.34 / 6.2 = 86% of GDP)
2005: $10,252,973,000 (another double!) (10.25 / 12.4 = 82% of GDP)
Anyway it is a much more interesting argument than I would hear when I listened to TV “pundits” years ago spout meaningless talking points at each other. Granted they argument is not going to be studied as a wonderful example of how we should debate. Still it is much above what passes for debate from our politicians (yes this is more a sad commentary on how failed our politicians are than a statement of how marvelous the argument on the GDP issue is between the two bloggers).
Here is a math question for you, what has a bigger impact moving from 15 to 18 mpg or 50 to 100 mpg?
Related: Government Debt as a Percentage of GDP – USA Consumers Paying Down Debt – Is Productivity Growth Bad? – Americans are Drowning in Debt
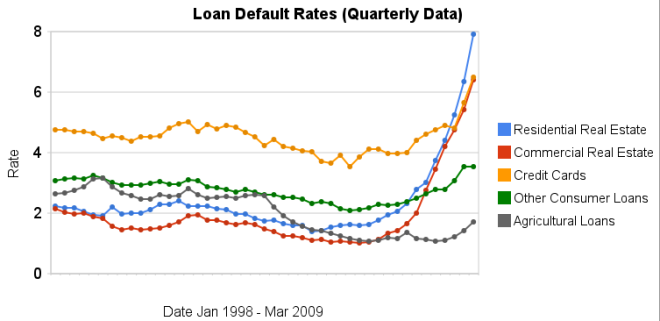 Chart showing loan default rates for real estate, consumer and agricultural loans for 1998 to 2009 by the Curious Cat Investing Economics Blog, Creative Commons Attribution, data from the Federal Reserve.
As you can see real estate default rates exploded in 2008. In the 4th quarter of 2007 residential default rates were 3.02% by the 4th quarter of 2008 they were 6.34% and in the 1st quarter of this year they were 7.91% (471 basis points above the 4th quarter of 2007). Commercial real estate default rates were at 2.74 in the 4th quarter of 2007, 5.43% in the fourth quarter of 2008 and 6.5% in the 1st quarter of 2009 (a 366 basis point increase).
Credit card default rates were much higher for the last 10 years (the 4-5% range while real estate hovered above or below 2%). In the last 2 quarters it has increased sharply. From 4.8% in the 3rd quarter 2008 to 5.66% in the 4th and 6.5% in the 1st quarter of 2009. The default rate on other consumer loans are up but nowhere near the amounts of real estate or credit cards.
Agricultural loan default rates are actually about as low now as they have every been 1.71%. That is up a bit from the 1.06% low the default rate hit in the 1st quarter of 2009 but actually lower than it was for half of the last decade (the last 5 years it has been lower but prior to that it was higher – in fact with higher default rates than either real estate loan category).
Related: Mortgage Rates: 6 Month and 5 Year Charts – Jumbo Loan Defaults Rise at Fast Pace – Continued Large Spreads Between Corporate and Government Bond Yields – Nearly 10% of Mortgages Delinquent or in Foreclosure