• curiouscat.com
  • About
  • Books
  • Glossary

    Categories

    • All
    • carnival (41)
    • chart (8)
    • Cool (35)
    • Credit Cards (45)
    • economic data (62)
    • Economics (439)
    • economy (126)
    • Financial Literacy (292)
    • Investing (324)
    • Personal finance (356)
    • Popular (43)
    • quote (194)
    • Real Estate (120)
    • Retirement (65)
    • Saving (90)
    • Stocks (158)
    • Taxes (51)
    • Tips (129)
    • Travel (7)

    Tags

    Asia banking bonds capitalism chart China commentary consumer debt Credit Cards credit crisis curiouscat debt economic data Economics economy employment energy entrepreneur Europe Financial Literacy government health care housing India interest rates Investing Japan John Hunter manufacturing markets micro-finance mortgage Personal finance Popular quote Real Estate regulation Retirement save money Saving spending money Stocks Taxes Tips USA

    Recently Posts

    • New Health Care Insurance Subsidies in the USA
    • Individual Stock Portfolio Investment Planning
    • Finding Great Investments Keeps Getting Harder
    • Huge Growth in USA Corporate Debt from 2005 to 2020
    • Retirement Portfolio Allocation for 2020
    • Tencent Gaming
    • Tucows: Building 3 Businesses With Strong Positive Cash Flow
    • The 20 Most Valuable Companies in the World – Jan 2019
    • 20 Most Popular Posts on the Curious Cat Investing and Economics Blog in 2018
    • An Inverted Yield Curve Predicts Recessions in the USA
  • Blogroll

    • Curious Cat Management Improvement Blog
    • Freakonomics
    • I Will Teach You to be Rich
    • Jubak Picks
  • Links

    • Articles on Investing
    • fool.com
    • Investing Books
    • Investment Dictionary
    • Leading Investors
    • Marketplace
    • Trickle Up
  • Subscribe

    • RSS Feed

    Curious Cat Kivans

    • Making a Difference

Investing and Economics Blog

Top 15 Manufacturing Countries in 2009

China continues to grow manufacturing is output. In 2009, the USA, and most countries saw declines in manufacturing production. China, however, continued to grow. China is now finally approaching the level of manufacturing done in USA. The latest data again shows the USA is the largest manufacturer but China looks poised to take over the number one spot soon.
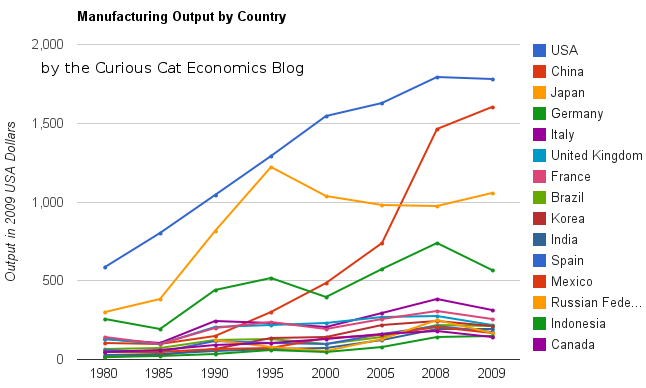
chart of manufacturing production by leading manufacturing countries
The chart showing manufacturing output by country was created by the Curious Cat Economics Blog based on UN data (in 2009 USA dollars). You may use the chart with attribution.

The large decline in Germany was 23%. This was a 18% decline in Euro terms, and when you added the decline of the Euro the total USA dollar decline was 23%. Quite extraordinary. Most European countries were down over 15%. In fact, so extraordinary it makes me question the data. World economic data is useful and interesting but it isn’t perfect. USA manufacturing declined just .5%. China increased manufacturing production by 9%.

The last 2 years, China has stopped separating out mining and utilities from manufacturing. The percentage of manufacturing (to manufacturing, mining and utilities) was 78% for 2005-2007 (I used 78% of the manufacturing, mining and utilities figure provided in the 2008 and 2009 data – but that could be wrong). The unadjusted 2009 China total was $2.05 trillion and for the USA the total manufacturing, mining and utilities was $2.33 trillion. In 2009, the manufacturing total was 76% of USA manufacturing, mining and utilities. The percentage varies significantly between countries (the Russian federation is about 55% and Japan about 91%) and various over time as a countries economy changes.

The big, long term story remains the same. China has continued to grow manufacturing output tremendously. I see very little data to support the stories about manufacturing having to leave China to go elsewhere (especially when you look at the “lower wages” counties mentioned in news stories – they are not growing at any significant rate). The USA is still manufacturing a huge amount and that production has steadily grown over time.

When you look back over the period from 1980 to today you can see

  1. The biggest story is the growth in Chinese manufacturing
  2. The USA started out the largest and has grown significantly
  3. Japan did very well from 1980 to 1995, and since they have struggled
  4. The USA, China, Japan are really far ahead of other countries in total manufacturing output, and Germany is solidly in 4th place.
  5. After that the countries are fairly closely grouped together. Though there are significant trends hidden by the scale of this graph, which I will explore in future posts. South Korea has growth significantly over this period, for example.
  6. The biggest macro trend that the data shows, but is not so visible in this chart (other than China’s growth), is the very strong performance of emerging markets (and in fact some counties have fully become manufacturing powerhouses during this period, most notably China but also, South Korea and Brazil). And I see that continuing going forward (though that is speculation).

Two more interesting pieces of data. Italy is the 5th largest manufacturing country, I don’t think many people would guess that. Since 1980 Italy surpassed the UK and France but China rocketed passed them. And Indonesia has moved into 14th place, edging out Canada in 2009.

I plan to take more time in 2011 to look at global manufacturing and other global economic data more closely and to write about it here.

Related: Data on the Largest Manufacturing Countries in 2008 – Top 12 Manufacturing Countries in 2007 – Top 10 Manufacturing Countries 2006 – Leading global manufacturers in 2004

January 4th, 2011 John Hunter | 5 Comments | Tags: Economics, economy, Popular, quote

Comments

5 Comments so far

  1. JMac on January 13, 2011 12:13 am

    Your rankings likely are inaccurate because they miss Taiwan. The problem is your underlying data–UN data unfortunately, very politically, always leaves out Taiwan.

  2. Praveen on February 7, 2011 1:50 pm

    Very interesting article. The manufacturing data does not parallel the jobs losses and it may have to do with how the data is collected. Does this data reflect manufacturing activity within the country borders, or simply an aggregation of corporate figures? In other words, if a US corporation manufactures only half of its $100B products in US factories, will the data add $100B to US manufacturing or only $50B? Regards

  3. Kenneth Duckworth on November 16, 2011 2:57 am

    I think to take account of job losses vs. manufacturing you need to also look at labor productivity. Manufacturing output and resulting employment in an age of ever increasing productivity are more and more disconnected.

  4. Chart of Historical Manufacturing Production Data by Country at Curious Cat Economics Blog on October 15, 2012 10:21 pm

    China has finally actually taken the lead as the largest manufacturer in the world. Reading many news sources and blogs you may have thought the USA lost the lead a couple of decades ago, but you would be wrong…

  5. Long Term View of Manufacturing Employment in the USA at Curious Cat Economics Blog on October 18, 2012 5:09 pm

    it does mean fewer manufacturing jobs, which are very good jobs, exist. This is a shame but something we shouldn’t anticipate changing. Believing we will globally, or in the USA, return to the huge number of manufacturing that were available previously jobs is not a wise conclusion to reach…

Name (required)

Email (required)

Website

Speak your mind

« Giving More Than Money to Charity
China Grows GDP 10.3% in 2010 »
Copyright © Curious Cat Investing and Economics Blog

    Personal Finance

    • Credit Card Tips
    • IRAs
    • Investment Risks
    • Loan Terms
    • Saving for Retirement
  • Archives

      All Posts
    • March 2021
    • January 2021
    • August 2020
    • March 2020
    • February 2020
    • January 2020
    • May 2019
    • January 2019
    • December 2018
    • November 2018
    • October 2018
    • August 2018
    • May 2018
    • February 2018
    • January 2018
    • November 2017
    • October 2017
    • September 2017
    • August 2017
    • July 2017
    • May 2017
    • April 2017
    • March 2017
    • February 2017
    • January 2017
    • December 2016
    • November 2016
    • October 2016
    • September 2016
    • August 2016
    • July 2016
    • June 2016
    • May 2016
    • April 2016
    • March 2016
    • February 2016
    • January 2016
    • December 2015
    • November 2015
    • October 2015
    • September 2015
    • August 2015
    • July 2015
    • June 2015
    • May 2015
    • April 2015
    • March 2015
    • February 2015
    • January 2015
    • December 2014
    • November 2014
    • October 2014
    • September 2014
    • August 2014
    • June 2014
    • April 2014
    • March 2014
    • February 2014
    • January 2014
    • December 2013
    • November 2013
    • September 2013
    • August 2013
    • July 2013
    • June 2013
    • May 2013
    • April 2013
    • March 2013
    • February 2013
    • January 2013
    • December 2012
    • November 2012
    • October 2012
    • September 2012
    • August 2012
    • July 2012
    • June 2012
    • May 2012
    • April 2012
    • March 2012
    • February 2012
    • January 2012
    • December 2011
    • November 2011
    • October 2011
    • September 2011
    • August 2011
    • July 2011
    • June 2011
    • May 2011
    • April 2011
    • March 2011
    • February 2011
    • January 2011
    • December 2010
    • November 2010
    • October 2010
    • September 2010
    • August 2010
    • July 2010
    • June 2010
    • May 2010
    • April 2010
    • March 2010
    • February 2010
    • January 2010
    • December 2009
    • November 2009
    • October 2009
    • September 2009
    • August 2009
    • July 2009
    • June 2009
    • May 2009
    • April 2009
    • March 2009
    • February 2009
    • January 2009
    • December 2008
    • November 2008
    • October 2008
    • September 2008
    • August 2008
    • July 2008
    • June 2008
    • May 2008
    • April 2008
    • March 2008
    • February 2008
    • January 2008
    • December 2007
    • November 2007
    • October 2007
    • September 2007
    • August 2007
    • July 2007
    • June 2007
    • May 2007
    • April 2007
    • March 2007
    • February 2007
    • January 2007
    • December 2006
    • November 2006
    • October 2006
    • April 2006
    • March 2006
    • January 2006
    • December 2005
    • October 2005
    • July 2005
    • May 2005
    • April 2005
    • April 2004