• curiouscat.com
  • About
  • Books
  • Glossary

    Categories

    • All
    • carnival (41)
    • chart (8)
    • Cool (35)
    • Credit Cards (45)
    • economic data (62)
    • Economics (439)
    • economy (126)
    • Financial Literacy (292)
    • Investing (324)
    • Personal finance (356)
    • Popular (43)
    • quote (194)
    • Real Estate (120)
    • Retirement (65)
    • Saving (90)
    • Stocks (158)
    • Taxes (51)
    • Tips (129)
    • Travel (7)

    Tags

    Asia banking bonds capitalism chart China commentary consumer debt Credit Cards credit crisis curiouscat debt economic data Economics economy employment energy entrepreneur Europe Financial Literacy government health care housing India interest rates Investing Japan John Hunter manufacturing markets micro-finance mortgage Personal finance Popular quote Real Estate regulation Retirement save money Saving spending money Stocks Taxes Tips USA

    Recently Posts

    • New Health Care Insurance Subsidies in the USA
    • Individual Stock Portfolio Investment Planning
    • Finding Great Investments Keeps Getting Harder
    • Huge Growth in USA Corporate Debt from 2005 to 2020
    • Retirement Portfolio Allocation for 2020
    • Tencent Gaming
    • Tucows: Building 3 Businesses With Strong Positive Cash Flow
    • The 20 Most Valuable Companies in the World – Jan 2019
    • 20 Most Popular Posts on the Curious Cat Investing and Economics Blog in 2018
    • An Inverted Yield Curve Predicts Recessions in the USA
  • Blogroll

    • Curious Cat Management Improvement Blog
    • Freakonomics
    • I Will Teach You to be Rich
    • Jubak Picks
  • Links

    • Articles on Investing
    • fool.com
    • Investing Books
    • Investment Dictionary
    • Leading Investors
    • Marketplace
    • Trickle Up
  • Subscribe

    • RSS Feed

    Curious Cat Kivans

    • Making a Difference

Investing and Economics Blog

Manufacturing Output by Country 1999-2011: China, USA, Japan, Germany

Chart of manufacturing output from 1999 to 2011 for China, USA, Japan and Germany

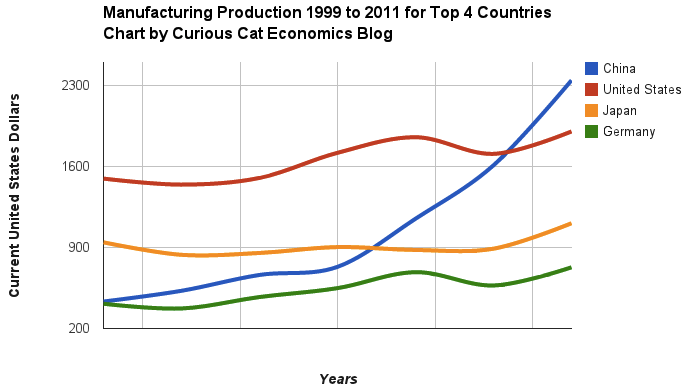
Chart of manufacturing production by China, USA, Japan and Germany from 1999 to 2011. The chart was created by the Curious Cat Economics Blog using UN data. You may use the chart with attribution. All data is shown in current USD (United States Dollar).

The story of global manufacturing production continues to be China’s growth, which is the conventional wisdom. The conventional wisdom however is not correct in the belief that the USA has failed. China shot past the USA, which dropped into 2nd place, but the USA still manufactures a great deal and has continually increased output (though very slowly in the last few years).

The story is pretty much the same as I have been writing for 8 years now. The biggest difference in that story is just that China actually finally moved into 1st place in 2010 and, maybe, the slowing of the USA growth in output (if that continues, I think the USA growth will improve). I said last year, that I expected China to build on the lead it finally took, and they did so. I expect that to continue, but I also wouldn’t be surprised to see China’s momentum slow (especially a few more years out – it may not slow for 3 or 4 more years).

As before, the four leading nations for manufacturing production remain solidly ahead of all the rest. Korea and Italy had manufacturing output of $313 billion in 2011 and Brazil moved up to $308 are in 4-6 place. Those 3 countries together could be in 4th place (ahead of just Germany). Even adding Korea and Italy together the total is short of Germany by $103 in 2011). I would expect Korea and Brazil to grow manufacturing output substantially more than Italy in the next 5 years.


The country supposedly growing their manufacturing the most in the last 10 years is Russia, up 375%. Frankly I don’t believe that data accurately reflects reality. China is next, up 346%. Followed by Indonesia up 345.6%, Brazil up 280%, India up 255%, South Korea up 163% and then Germany up 95%. The figures are all in current USD, inflation alone would result in an increase of about 27% for the period. The slowest gains in manufacturing output are the UK (up just 21%), USA up 32%, Japan up 33% and France up 43%.

Chart of manufacturing output from 1999 to 2011 for Countries 5 to 15

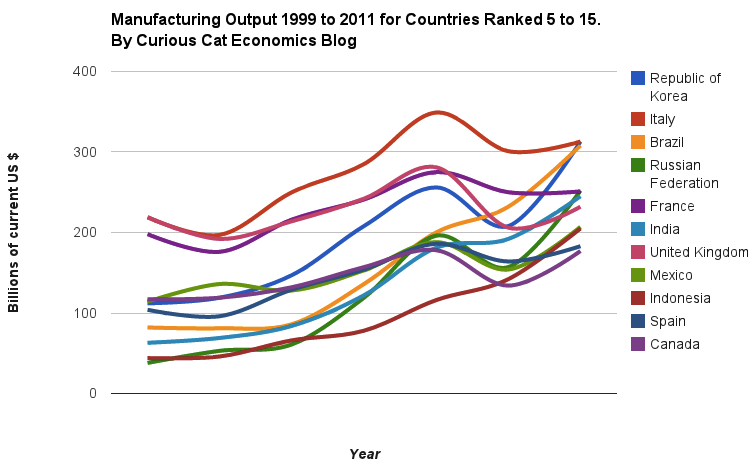
Chart of manufacturing production from 1999 to 2011 by the 5th through 14th largest manufacturing countries. The chart was created by the Curious Cat Economics Blog using UN data. You may use the chart with attribution. All data is shown in current USD (United States Dollar).

Of course, when looking at economic data all sorts of questions can be raised. My not believing the Russia data, for example. Also even accepting an inflation of 27% for the economy as a whole, for many manufactured goods that may not be very accurate. And using US $ for everyone creates some issues based on foreign exchange movements (so a country could actually produce 10% more in their own currency but if that currency fell 20% against the $ then they would show a 10% decline in manufacturing output). The data has weaknesses that have to be understood. Even so the data is useful and provides a very good long term picture of what is really going on economically.

I actually believe the USA’s 10 year figure is a discrepancy, but we will see how things shape up in the next 5 to 10 years. The USA had some very bad years from 2006 to 2009.

I expect in the next 10 years Indonesia and Brazil will do quite well and have a great shot at being among the tops in this group of the 14 leading manufacturing countries. China will likely do well, but I think growth will slow and it may well fall back from the lead (though likely remain somewhat near the top). India could do well, but their continued failure to address infrastructure and corruption problems make it very challenging. If they successfully addressed those they could easily be in the lead. I doubt they will though, so I expect them to be held back. Mexico has a chance to do very well, though they also have problems to deal with.

A bunch of the leading countries will struggle to grow significantly. The USA, Japan, Germany, Italy, Russia, France, UK, Spain and Canada are not likely to do fantastically. I would expect the USA to be near the top of this group. That leaves Korea as a country I think can outperform all in the previous sentence but to have trouble keeping up with any of the countries in the previous paragraph that don’t create problems for themselves.

Related: Manufacturing Output as Percent of GDP from 1980 to 2010 by Country – Manufacturing Employment Data: USA, Japan, Germany, UK and more, 1990 to 2009 – Top 15 Manufacturing Countries in 2009 – How Accurate is Manufacturing Data? – Top 12 Manufacturing Countries in 2007

February 5th, 2013 John Hunter | 5 Comments | Tags: economic data, economy, Popular, quote

Comments

5 Comments so far

  1. Sven on February 23, 2013 10:18 am

    I agree, China will have the lead. Interesting for me to watch will be Brazil. They have more potential, because there are so many things which don’t work well. So if only one or two of the problems will be solved things would look different. Key is the education. Brazil would have a lot of young work forces but they are really not effiecient. And then of course competitiveness is too low tow. lets see where it goes

  2. Country H-index Ranking for Science Publications » Curious Cat Science Blog on January 9, 2014 8:50 am

    Countries with the top H-index rankings USA, United Kingdom, Germany, France, Canada, Japan…

  3. Global Stock Market Capitalization from 2000 to 2012 at Curious Cat Investing and Economics Blog on January 17, 2015 8:03 pm

    The first chart shows the largest 4 market capitalizations (2012: USA $18.6 trillion, China and Japan at $3.7 trillion and UK at $3 trillion)…

  4. Economic Competition and Supply Chains at Curious Cat Investing and Economics Blog on July 11, 2017 6:39 am

    […] changes in manufacturing globally over the last few decades. As we have shown, the data shows that the USA remained the largest manufacturer until 2010 when China finally took over as the […]

  5. Moumita Mallick on July 17, 2017 3:11 am

    The whole global economy is on the verge of becoming upside down again. Due to the global synchronizing the leader of economic world has come together to make the present world economic situation better.

Name (required)

Email (required)

Website

Speak your mind

« 157,000 Jobs Added in January and Adjustments for the Prior Two Months add 127,000 More
Curious Cat Investing, Economics and Personal Finance Carnival #41 »
Copyright © Curious Cat Investing and Economics Blog

    Personal Finance

    • Credit Card Tips
    • IRAs
    • Investment Risks
    • Loan Terms
    • Saving for Retirement
  • Archives

      All Posts
    • March 2021
    • January 2021
    • August 2020
    • March 2020
    • February 2020
    • January 2020
    • May 2019
    • January 2019
    • December 2018
    • November 2018
    • October 2018
    • August 2018
    • May 2018
    • February 2018
    • January 2018
    • November 2017
    • October 2017
    • September 2017
    • August 2017
    • July 2017
    • May 2017
    • April 2017
    • March 2017
    • February 2017
    • January 2017
    • December 2016
    • November 2016
    • October 2016
    • September 2016
    • August 2016
    • July 2016
    • June 2016
    • May 2016
    • April 2016
    • March 2016
    • February 2016
    • January 2016
    • December 2015
    • November 2015
    • October 2015
    • September 2015
    • August 2015
    • July 2015
    • June 2015
    • May 2015
    • April 2015
    • March 2015
    • February 2015
    • January 2015
    • December 2014
    • November 2014
    • October 2014
    • September 2014
    • August 2014
    • June 2014
    • April 2014
    • March 2014
    • February 2014
    • January 2014
    • December 2013
    • November 2013
    • September 2013
    • August 2013
    • July 2013
    • June 2013
    • May 2013
    • April 2013
    • March 2013
    • February 2013
    • January 2013
    • December 2012
    • November 2012
    • October 2012
    • September 2012
    • August 2012
    • July 2012
    • June 2012
    • May 2012
    • April 2012
    • March 2012
    • February 2012
    • January 2012
    • December 2011
    • November 2011
    • October 2011
    • September 2011
    • August 2011
    • July 2011
    • June 2011
    • May 2011
    • April 2011
    • March 2011
    • February 2011
    • January 2011
    • December 2010
    • November 2010
    • October 2010
    • September 2010
    • August 2010
    • July 2010
    • June 2010
    • May 2010
    • April 2010
    • March 2010
    • February 2010
    • January 2010
    • December 2009
    • November 2009
    • October 2009
    • September 2009
    • August 2009
    • July 2009
    • June 2009
    • May 2009
    • April 2009
    • March 2009
    • February 2009
    • January 2009
    • December 2008
    • November 2008
    • October 2008
    • September 2008
    • August 2008
    • July 2008
    • June 2008
    • May 2008
    • April 2008
    • March 2008
    • February 2008
    • January 2008
    • December 2007
    • November 2007
    • October 2007
    • September 2007
    • August 2007
    • July 2007
    • June 2007
    • May 2007
    • April 2007
    • March 2007
    • February 2007
    • January 2007
    • December 2006
    • November 2006
    • October 2006
    • April 2006
    • March 2006
    • January 2006
    • December 2005
    • October 2005
    • July 2005
    • May 2005
    • April 2005
    • April 2004