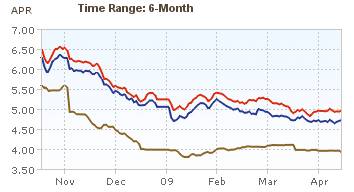
 Showing mortgage rates over the last 6 months. Red: 30 year fixed rate. Blue: 15 year fixed rate. Tan: 1 year adjustable rate.
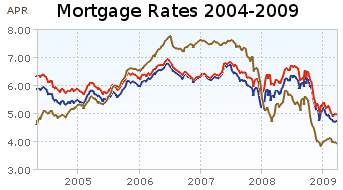 Showing mortgage rates over the last 5 years. Red: 30 year fixed rate. Blue: 15 year fixed rate. Tan: 1 year adjustable rate. From Yahoo Finance, for conventional loans in Virginia.
The 6 month chart shows that mortgage rates have been declining ever so slightly. Rates on a 1 year adjustable mortgage fell from 5.5 to 4% and have stayed near 4% for all of 2009. 30 and 15 year rates (15 year rates staying about 25 basis points cheaper) have declined from 6.5%, 6 months ago to about 5% at the start of the year and have moved around slightly since. This is while the yield 10 year government treasuries have been rising (normally 30 year fixed rate mortgages track moves in the 10 year government bond). The federal reserve has been buying bonds in order to push down the yield (and stimulate mortgage financing and other borrowing).
Mortgage rates certainly could fall further but the current rates are extremely attractive and I just locked in a mortgage refinance for myself. I am getting a 20 year fixed rate mortgage; I didn’t want to extend the mortgage period by getting another 30 year fixed rate mortgage. For me, the risk of increasing rates outweigh the benefits of picking up a bit lower rate given the current economic conditions. But I can certainly understand the decision to hold out a bit longer in the hopes of getting a better rate. If I had to guess I would say rates will be lower during the next 3 months, but I am not confident enough to hold off, and so I decided to move now.
Related: Mortgage Rates Falling on Fed Housing Focus – posts on mortgages – 30 Year Fixed Mortgage Rates and the Fed Funds Rate – Continued Large Spreads Between Corporate and Government Bond Yields – Lowest 30 Year Fixed Mortgage Rates in 37 Years –
Nonfarm payroll employment continued to decline in April, and the unemployment rate rose from 8.5 to 8.9 percent, the Bureau of Labor Statistics of the U.S. Department of Labor reported today. Since the recession began in December 2007, 5.7 million jobs have been lost. In April, job losses were large and widespread across nearly all major private-sector industries. Overall, private-sector employment fell by 611,000.
The number of unemployed persons increased by 563,000 to 13.7 million. Unemployment rates for April for adult men reached 9.4% and for adult women 7.1%. The number of long-term unemployed (those jobless for 27 weeks or more) increased by 498,000 to 3.7 million over the month and has risen by 2.4 million since the start of the recession in December 2007.
The civilian labor force participation rate rose in April to 65.8 percent, and the employment-population ratio was unchanged at 59.9 percent. The employment-population ratios for adult men and women showed little or no change over the month. However, since December 2007, the men’s ratio was down by 440 basis points, while the women’s ratio was down by 130 basis points. Since those that stop looking for work (retire or just stop actively looking) are not counted as unemployed the participation rate is a useful statistic to examine in conjunction with the unemployment rate.
Much of the commentary on the April job losses have been that the decrease in the number of job losses from previous months shows the economy is stabilizing. While it is true losing 611,000 jobs is better than losing 700,000 jobs, losing 611,000 is still very bad. The unemployment rate increased to 8.9% and long term unemployment is increasing drastically. This is hardly good economic news. It is true that there is hope that the economy is turning around, but the employment data we have so far is hardly positive (employment data is a lagging economic indicator so it is not surprising employment data does not recover before other signs point to improvement).
Related: Another 663,000 Jobs Lost in March in the USA – USA Unemployment Rate Rises to 8.1%, Highest Level Since 1983 – Over 500,000 Jobs Disappeared in November – What Do Unemployment Stats Mean?
The 2000–2002 bear market had three, with average gains of 21 per cent in the Dow Jones Industrials over 45 days.
The granddaddy of all bear markets, 1929 –1932, had six false alarms with an average gain of 47 per cent. And Japan’s ongoing bear saw the Nikkei rise by at least a third four times in its first four years with 10 more false dawns since then.
Bear markets typically end with a whimper rather than a bang, casting doubt on the latest recovery according to Hussman Econometrics, which analysed numerous US market bottoms and bear market rallies. With the exception of the 1987 crash, the month before the lowest point of a downturn saw a gradual descent.
I don’t put much money on the line trying to time the stock market. I thought the decline was overdone and I have found some things to buy. I am not convinced the current assent of the USA market especially means the bear market is over. If I had to sell stocks, I would be much happier to do it now than 3 months ago. That said, I am not selling anything or reducing my planned buying (401k buying).
Related: Financial Markets Continue Panicky Behavior (Oct 2008) – Trying to Beat the Market – Add to Your 401(k) and IRA – see my investing portfolio results
Consumer borrowing falls in March at fastest pace in over 18 years, Americans saving more
In dollar terms, consumer borrowing plunged by $11.1 billion. That’s the largest dollar amount on records dating to 1943, and more than three times the $3.5 billion drop that economists expected. The borrowing category that includes credit cards dropped 6.8 percent in March after a 12.1 percent plunge in February. The category that includes auto loans fell 4.2 percent after rising by 1.2 percent in February.
The Commerce Department last week said that the personal savings rate edged up to 4.2 percent in March, marking the first time in a decade that the savings rate has been above 4 percent for three straight months.
Good. Consumer debt is far to large and should be paid down. This is a start but a small start, but a much larger reduction in outstanding consumer debt is needed before we have reached a healthy level of debt. The continued improvement in that debt level signifies a stronger economy. Far too many financial journalists instead of pointing out the benefits of such improvement note that this reduces current consumption (and thus, effectively, will lower current GDP – compared to what it would be if we continued to spend beyond our means). You cannot spend money your don’t have forever.
Having more stuff in your house (along with an increased outstanding credit card balance) does not make you economically more successful. And the same holds true for the economy. Having more stuff sitting in people’s house and an increasing debt load is not the sign of a stronger economy (even if it is a route to a higher current GDP). Increased saving and reducing debt will strengthen the economy and improve our economic success over the long term.
Related: Will Americans Actually Save and Worsen the Recession? – Proper credit card use – Personal Saving and Personal Debt in the USA – Americans are Drowning in Debt – Buying Stuff to Feel Powerful
Your Life Insurance Policy May Not Be Protected by Ben Levisohn, Business Week
…
Insurance customers need to be more vigilant. Stop focusing only on cost and service and start worrying about solvency. Check such agencies as Standard & Poor’s (MHP), Fitch Ratings, Moody’s, and A.M. Best to find the highest-rated companies, and be alert for downgrades. Then dig deeper. Find out about an insurer’s exposure to real estate and mortgages and make sure its debt holdings are investment-grade. “Everyone’s under the false assumption that it doesn’t matter what company you buy from,” says Thomas Archer, chairman of financial-services firm Archer Financial Group in New York. “It does.”
• $300,000 in life insurance death benefits
• $100,000 in cash surrender or withdrawal value for life insurance
• $100,000 in withdrawal and cash values for annuities
• $100,000 in health insurance policy benefits
• $300,000 in homeowners benefits
• $300,000 in auto insurance benefits
One option is to diversify your insurance coverage, just like you diversifying investments. Historically insurance company failures have been rare, and even it is even rarer that state funds don’t cover the insurance. But if you have large amounts of insurance you can be a bit safer by having your life insurance needs covered by multiple insurers.
Related: Personal Finance Basics: Long-term Care Insurance – Insurers Raise Fees on Variable Annuities – Personal Finance Basics: Health Insurance – How to Protect Your Financial Health
Read more
Each year Warren Buffett and Charlie Munger answer questions in front of crowds of tens of thousands of Berkshire Hathaway shareholders in Omaha, Nebraska. The question and answer sessions provide great wisdom on economics, investing and management. Here are some of the highlights I have found from the meeting yesterday.
Buffett, Munger praise Google’s ‘moat’
Berkshire’s Buffett Calls Wells Fargo ‘Fabulous’ Bank
The stock closed at $19.61 yesterday after falling below $9 in March. Buffett said he was speaking to a class the day the shares dropped that low and told students that, at that price, “If I had to put all of my net worth into stock, that would be the stock.”
Buffett, who has said he values lenders partly on their ability to acquire funds from depositors, told shareholders today that he’d “love” to buy the entire bank and is unable to do so because Berkshire wouldn’t get permission from regulators.
But he warned that efforts such as the Treasury’s $700 billion Troubled Asset Relief Program and the $787 billion fiscal stimulus plan passed this year by Congress will have to be paid for, one way or another. And with political leaders showing little inclination to raise taxes, one sure way to pay for excess spending is to inflate the value of the currency, Buffett said. The biggest losers in a surge of inflation, he added, would include holders of bonds and other fixed-income assets.
…
“Government does need to step in,” Buffett said, referring to the 6% contraction of the U.S. economy in the fourth quarter of 2008 and the first quarter of 2009.
That’s not to say he is pleased with the earmarks Congress has attached to some of the rescue legislation. Inevitably, Buffett said, when big organizations turn massive resources on a problem, “there’s a fair amount of slop.”
Related: Berkshire Hathaway Annual Meeting 2008 – Warren Buffett’s Letter to Shareholders 2009 – Great Advice from Warren Buffett – Warren Buffett’s 2004 Annual Report
Read more
U.S. Gas Fields Go From Bust to Boom
…
Huge new fields also have been found in Texas, Arkansas and Pennsylvania. One industry-backed study estimates the U.S. has more than 2,200 trillion cubic feet of gas waiting to be pumped, enough to satisfy nearly 100 years of current U.S. natural-gas demand.
The discoveries have spurred energy experts and policy makers to start looking to natural gas in their pursuit of a wide range of goals: easing the impact of energy-price spikes, reducing dependence on foreign oil, lowering “greenhouse gas” emissions and speeding the transition to renewable fuels.
…
new technologies and a drilling boom have helped production rise 11% in the past two years. Now there’s a glut, which has driven prices down to a six-year low and prompted producers to temporarily cut back drilling and search for new demand.
The natural-gas discoveries come as oil has become harder to find and more expensive to produce. The U.S. is increasingly reliant on supplies imported from the Middle East and other politically unstable regions. In contrast, 98% of the natural gas consumed in the U.S. is produced in North America.
Related: Oil Consumption by Country – posts on energy economics – Forecasting Oil Prices – South Korea To Invest $22 Billion in Overseas Energy Projects – Wind Power Provided Over 1% of Global Electricity in 2007
Jim Jubak’s articles not only provide specific stock picks but also offer a good view on how to analyze stocks. Reading his columns is something I would recommend for anyone interested in investing in individual stocks (in addition to reading excellent books on investing). His latest column is 5 tech stocks full of promise
Then you’d probably spend some time looking at the price trends in the market. If you did, you’d notice that technology stocks were showing relative strength by hanging above their January highs (in contrast to sectors that are fighting to get back to January highs). You’d also see from your study of the charts that Cisco shares were near resistance levels set by their 200-day moving average and their April high of about $18.50.
…
None of that tells you whether the stock is reasonably priced. To figure that out, you might look at the average P/E ratio of the past five years. Because the average was 21.6, you could conclude that Cisco, at 14.1, was undervalued, since the price in the future will climb until Cisco trades again at something like 21.6 times earnings. Or you could conclude that the lower P/E ratio was a logical reaction by investors to the company’s falling earnings. Wall Street analysts now think Cisco’s earnings will fall 23.2% in fiscal 2009 and 6.3% in fiscal 2010.
Setting a target price isn’t a science. Where your target winds up is a result of the assumptions you make going in. I like to check the range of price targets for a stock and compare that with its current price. For Cisco, the range for a 12-month target price now seems to fall between $16 and $31 a share. At a recent $18.50 or so, Cisco has been trading above the most pessimistic target, but not by a great deal. Depending on your read for the market as a whole, that means Cisco is toward the cheap end of reasonable but not a compelling buy if you think, as I do, that this rally will yield to a correction in the next month or six weeks.
Related: 12 Stocks for 10 Years (March 2009 Update) – 10 Stocks for Income Investors – Dollar Cost Averaging – Does a Declining Stock Market Worry You?