• curiouscat.com
  • About
  • Books
  • Glossary

    Categories

    • All
    • carnival (41)
    • chart (8)
    • Cool (35)
    • Credit Cards (45)
    • economic data (62)
    • Economics (439)
    • economy (126)
    • Financial Literacy (292)
    • Investing (324)
    • Personal finance (356)
    • Popular (43)
    • quote (194)
    • Real Estate (120)
    • Retirement (65)
    • Saving (90)
    • Stocks (158)
    • Taxes (51)
    • Tips (129)
    • Travel (7)

    Tags

    Asia banking bonds capitalism chart China commentary consumer debt Credit Cards credit crisis curiouscat debt economic data Economics economy employment energy entrepreneur Europe Financial Literacy government health care housing India interest rates Investing Japan John Hunter manufacturing markets micro-finance mortgage Personal finance Popular quote Real Estate regulation Retirement save money Saving spending money Stocks Taxes Tips USA

    Recently Posts

    • New Health Care Insurance Subsidies in the USA
    • Individual Stock Portfolio Investment Planning
    • Finding Great Investments Keeps Getting Harder
    • Huge Growth in USA Corporate Debt from 2005 to 2020
    • Retirement Portfolio Allocation for 2020
    • Tencent Gaming
    • Tucows: Building 3 Businesses With Strong Positive Cash Flow
    • The 20 Most Valuable Companies in the World – Jan 2019
    • 20 Most Popular Posts on the Curious Cat Investing and Economics Blog in 2018
    • An Inverted Yield Curve Predicts Recessions in the USA
  • Blogroll

    • Curious Cat Management Improvement Blog
    • Freakonomics
    • I Will Teach You to be Rich
    • Jubak Picks
  • Links

    • Articles on Investing
    • fool.com
    • Investing Books
    • Investment Dictionary
    • Leading Investors
    • Marketplace
    • Trickle Up
  • Subscribe

    • RSS Feed

    Curious Cat Kivans

    • Making a Difference

Investing and Economics Blog

Government Debt Compared to GDP 1990-2007

Government debt as percent of GDP 1990-2007Chart showing government debt as a percentage of GDP by Curious Cat Investing Economics Blog, Creative Commons Attribution, data from OECD, Sept 2009.
                

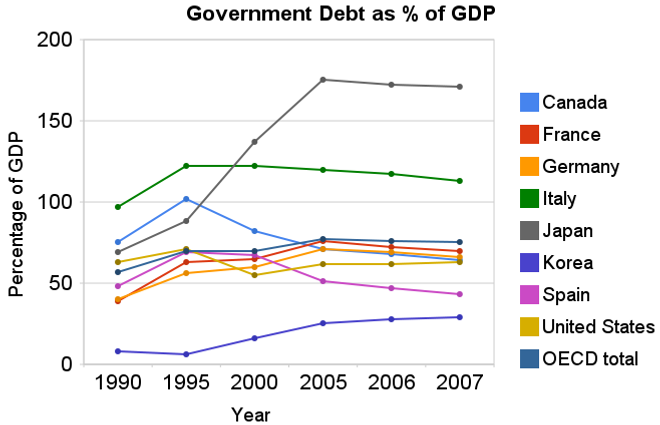
For 2007 most countries slightly decreased their government debt to GDP ratio – as economic growth exceeded debt growth. The OECD is made up of countries in Europe and the USA, Japan, Korea, Australia, New Zealand and Canada. The overall OECD debt to GDP ratio decreased from 77% in 2005 to 75% in 2007. The USA moved in the opposite direction increasing from 62% to 63%: still remaining far below the OECD total. Most likely 2008, 2009 and 2010 will see both the USA and other OECD national dramatically increase the debt burden.

Compared to the OECD countries the USA is actually better than average. The chart shows the percentage of GDP that government debt represents for various countries. The USA ended 2007 at 63% while the overall OECD total is 75%. In 1990 the USA was at 63% and the OECD was at 57%. Japan is the line way at the top with a 2007 total of 171% (that is a big problem for them). Korea is in the best shape at just a 29% total in 2007 but that is an increase from just 8% in 1990.

Related: Government Debt as a Percentage of GDP Through 2006 – Oil Consumption by Country in 2007 – Federal Deficit To Double This Year – Politicians Again Raising Taxes On Your Children – True Level of USA Federal Deficit – Top 12 Manufacturing Countries in 2007

The USA federal government debt is far too large, in my opinion. We have been raising taxes on future taxpayers for several decades, to finance our current spending. Within reason deficit spending is fine. What that reasonable level is however, is not easy to know. One big problem with the past few decades is that during very prosperous economic times we spent money that we didn’t have, choosing to raise taxes on the future (instead of either not spending as much or paying for what we were spending by raising taxes to pay for current spending).

By not even paying for what we are spending when times were prosperous we put ourselves in a bad situation when we have poor economic conditions – like today. If we were responsible during good economic times (and at least paid for what we spent) we could have reduced our debt as a percentage of GDP. Even if we did not pay down debt, just by not increasing the outstanding debt while the economy grew the ratio of debt to GDP would decline. Then when times were bad, we could afford to run deficits and perhaps bring the debt level up to some reasonable level (maybe 40% of GDP – though it is hard to know what the target should be, 40% seems within the realm of reason to me, for now).

There is at least one more point to remember, the figures in the chart are based on reported debt. The USA has huge liabilities that are not accounted for. So you must remember that the actually debt is much higher than reported in the official debt calculation.

Notes on the Data from the OECD web site.
For most countries, gross financial liabilities refer to the liabilities (short and long-term) of all the institutions in the general government sector, as defined in the 1993 System of National Accounts (SNA) or in the 1995 European System of Accounts (ESA). This definition differs from the definition of debt applied under the Maastricht Treaty essentially in two respects. First, gross debt according to the Maastricht definition excludes trade credits and advances, as well as shares and insurance technical reserves. Second, government bonds are valued at nominal values instead of at market value or issue price plus accrued interest as required by the SNA rules. The United States and Canada also value government bonds at nominal value.

In principle, debts within and between different levels of government are consolidated; a loan from one level of government to another represents both an asset and an equal liability for the government as a whole and so it cancels out (is “consolidated”) for the general government sector.

The comparability of data can be affected in two ways. First, national differences in implementing SNA/ESA definitions can affect the comparability of government debt across countries. Second, changes in implementing SNA/ESA definitions can affect the comparability of data within a country over time.

There are two standard ways to measure the extent of government debt – by reference to gross financial liabilities or by reference to net financial liabilities – the latter being measured as gross financial liabilities minus financial assets. Gross financial liabilities as a percentage of GDP is the most commonly used government debt ratio and is shown here.

September 3rd, 2009 John Hunter | 2 Comments | Tags: Economics, Financial Literacy, quote

Comments

2 Comments so far

  1. Dollar Decline Due to Government Debt or Total Debt? at Curious Cat Investing and Economics Blog on November 28, 2009 3:21 pm

    […] reason, to me. The federal debt is large and growing quickly, which is a problem. But still the USA federal debt to GDP is lower than the OECD average. Even with a few more years of crazy federal debt growth the USA will still be below that […]

  2. Government Debt as Percentage of GDP 1990-2008 – USA, Japan, Germany… at Curious Cat Investing and Economics Blog on March 15, 2010 8:46 am

    […] data here is very similar to the OECD data I provided earlier, Government Debt Compared to GDP 1990 to 2007, though with some notable differences. In the OECD data was still in the best shape, but is seen as […]

Name (required)

Email (required)

Website

Speak your mind

« Curious Cat Investing and Economics Carnival #4
Unemployment Rate Increases to 9.7% »
Copyright © Curious Cat Investing and Economics Blog

    Personal Finance

    • Credit Card Tips
    • IRAs
    • Investment Risks
    • Loan Terms
    • Saving for Retirement
  • Archives

      All Posts
    • March 2021
    • January 2021
    • August 2020
    • March 2020
    • February 2020
    • January 2020
    • May 2019
    • January 2019
    • December 2018
    • November 2018
    • October 2018
    • August 2018
    • May 2018
    • February 2018
    • January 2018
    • November 2017
    • October 2017
    • September 2017
    • August 2017
    • July 2017
    • May 2017
    • April 2017
    • March 2017
    • February 2017
    • January 2017
    • December 2016
    • November 2016
    • October 2016
    • September 2016
    • August 2016
    • July 2016
    • June 2016
    • May 2016
    • April 2016
    • March 2016
    • February 2016
    • January 2016
    • December 2015
    • November 2015
    • October 2015
    • September 2015
    • August 2015
    • July 2015
    • June 2015
    • May 2015
    • April 2015
    • March 2015
    • February 2015
    • January 2015
    • December 2014
    • November 2014
    • October 2014
    • September 2014
    • August 2014
    • June 2014
    • April 2014
    • March 2014
    • February 2014
    • January 2014
    • December 2013
    • November 2013
    • September 2013
    • August 2013
    • July 2013
    • June 2013
    • May 2013
    • April 2013
    • March 2013
    • February 2013
    • January 2013
    • December 2012
    • November 2012
    • October 2012
    • September 2012
    • August 2012
    • July 2012
    • June 2012
    • May 2012
    • April 2012
    • March 2012
    • February 2012
    • January 2012
    • December 2011
    • November 2011
    • October 2011
    • September 2011
    • August 2011
    • July 2011
    • June 2011
    • May 2011
    • April 2011
    • March 2011
    • February 2011
    • January 2011
    • December 2010
    • November 2010
    • October 2010
    • September 2010
    • August 2010
    • July 2010
    • June 2010
    • May 2010
    • April 2010
    • March 2010
    • February 2010
    • January 2010
    • December 2009
    • November 2009
    • October 2009
    • September 2009
    • August 2009
    • July 2009
    • June 2009
    • May 2009
    • April 2009
    • March 2009
    • February 2009
    • January 2009
    • December 2008
    • November 2008
    • October 2008
    • September 2008
    • August 2008
    • July 2008
    • June 2008
    • May 2008
    • April 2008
    • March 2008
    • February 2008
    • January 2008
    • December 2007
    • November 2007
    • October 2007
    • September 2007
    • August 2007
    • July 2007
    • June 2007
    • May 2007
    • April 2007
    • March 2007
    • February 2007
    • January 2007
    • December 2006
    • November 2006
    • October 2006
    • April 2006
    • March 2006
    • January 2006
    • December 2005
    • October 2005
    • July 2005
    • May 2005
    • April 2005
    • April 2004