Tesco is one of the holdings in my 12 stocks for 10 years portfolio (currently returning 450 basis point above S&P 500 annually). I agree with this well documented post – Tesco: Consistent Earnings Growth at Attractive Price
…
Tesco has leading market share positions in Hungary (#1), Thailand (#1), Ireland (#2), S. Korea (#2), Malaysia (#2), Slovakia (#3), Poland (#4) and Czech Republic (#4).
The company entered China several years ago and plans to open more hypermarkets and shopping centers over the next decade. The Chinese retail market remains very fragmented and the top three players each control less than 1% market share.
…
Tesco generated £5 billion in operating cash flow last year, benefiting from improvement in working capital efficiency and good inventory management. Its capital expenditures were £4.7 billion last year (£2.6 billion in UK and £2.1 billion in international). The company expects its capital expenditures to decline to £3.5 billion this year through spending less on mixed use development land and purchasing fewer existing stores from UK competitors.
…
Tesco ended the year with £9.6 billion in net debt, up £3.4 billion from the prior year… Nevertheless, its interest coverage ratio was 8.9x last year and does not appear too aggressive.
A big part of my reason for buying Tesco is their management teams commitment to lean thinking (Toyota Production System) management methods. I still worry they will not continue to adopt these methods more thoroughly but I believe superior management methods are one reason their performance has been good in the past and should improve even more if they continue to apply those methods more.
Related: Jubak Looks at 5 Technology Stocks – 10 Stocks for Income Investors – Small Business Profit and Cash Flow – GM and Citigroup Replaced by Cisco and Travelers in the Dow
Last November USA consumer debt fell, by a then record of $8 billion. In July, 2009, consumer debt was reduced another $21 billion, which is a good sign.
April of 2008 USA consumer debt stood at $2.54 trillion. Based on a population of 300 million people that would mean $8,467 for every person in just personal debt. Living beyond your means is not a good thing. After the July decrease of $21.55 billion, the total consumer debt stood at $2.47 trillion, a decline of $70 billion over the last 15 months.
Decreasing this debt level was (and is) necessary. If that means we have some suffering today to pay for living beyond our means for years the ‘fix’ is not to continue to live beyond our means. The ‘fix’ is to accept the consequences of past behavior and build a more sustainable economy now for the future.
Consumer credit down record amount in July
Consumers have retrenched since the financial crisis hit in full force last September. Credit has fallen in every month except January. In percentage terms, the drop in credit is the biggest since June 1975.
And on a year-on-year basis, credit is down 4.3%, the biggest drop since June 1944. The retrenchment was much more than expected. Economists surveyed by MarketWatch expected consumer credit to decline by $4.3 billion. There were also sharp downward revisions to June data.
Economists said shrinking credit might strangle the recovery. “There is no real way to put a positive spin on these data. Credit is still shrinking and that is going to have an impact on consumption,” wrote Charmaine Buskas, senior economics strategist at TD Securities, in a note to clients.
…
credit-card debt fell $6.11 billion, or 8.5%, in July to $905.58 billion. This is the record 11th straight monthly drop in credit card debt. Non-revolving credit, such as auto loans, personal loans and student loans fell a record $15.44 billion or 11.7% to $1.57 trillion.
Here is a positive spin on it. We owe $21.5 billion less than we did last month. How lost are we that there is no positive way to spin owing less money than you used to owe?
Related: Personal Saving and Personal Debt in the USA – Americans are Drowning in Debt
China’s economy continues to grow quickly. It looks as though that, along with the slump in US car sales, likely will lead to China taking the world sales lead for cars (I would imagine for the first time ever the USA has not held this title). China 2009 Vehicle Sales May Rise 28% on Stimulus:
China has boosted auto sales this year through tax cuts and subsidies as a part of a wider 4 trillion yuan ($586 billion) stimulus that has shielded the country from the worst of the global recession. U.S. sales have slumped 28 percent, pushing the old GM and Chrysler LLC into bankruptcy. Last year’s total was 13.2 million, compared with 9.4 million in China.
Partially due to the strong internal Chinese demand (and partially due to Chinese regulation) India actually exports more cars than China. 5 times as many cars are purchased in China as are bought in India.
Indian Car Exports Beat China’s
…
In contrast, China’s exports slumped 60 percent to 164,800 between January and July, according to government data. Vehicles produced in Thailand for export declined 43 percent to 263,768, according to the Thai Automotive Club.
South Korean exports dropped 31 percent to 1.12 million units, according to the Korea Automobile Manufacturers Association. Japan, the world’s largest automobile producer and exporter, shipped 1.77 million cars, trucks and buses.
Related: The Relative Economic Position of the USA is Likely to Decline – Manufacturing Cars in the USA – Rodgers on the US and Chinese Economies
The unemployment rate in the USA continued the climb toward 10% in August in the aftermath of the credit crisis. Nonfarm payroll employment decline in August, by 216,000 more jobs, and the unemployment rate rose to 9.7%, the U.S. Bureau of Labor Statistics reported today. Since December 2007, employment has fallen by 6.9 million jobs.
In August, the number of unemployed persons increased by 466,000 to 14.9
million, and the unemployment rate rose to 9.7%. The unemployment rates for adult men (10.1%), whites (8.9%), and Hispanics (13.0%) rose in August. The jobless rates for adult women (7.6%), teenagers (25.5%), and blacks (15.1%) were little changed over the month.
The civilian labor force participation rate remained at 65.5% in August. The employment-population ratio, at 59.2%, edged down over the month and has declined by 3.5 percentage points since the recession began in December 2007.
In August, the number of persons working part time for economic reasons was little changed at 9.1 million. These individuals indicated that they were working part time because their hours had been cut back or because they were unable to find a full-time job.
In August, manufacturing employment continued to trend downward, with a decline of 63,000. The pace of job loss has slowed throughout manufacturing in recent months. Employment in health care continued to rise in August (28,000), with gains in ambulatory care and in nursing and residential care. Health care has added 544,000 jobs since the start of the recession.
In August, the average workweek for production and nonsupervisory
workers on private nonfarm payrolls was unchanged at 33.1 hours.
The manufacturing workweek and factory overtime also showed no
change over the month (at 39.8 hours and 2.9 hours, respectively).
Related: Unemployment Rate Drops Slightly to 9.4% – posts on employment – May 2009 Unemployment Rate Jumps to 9.4% – California Unemployment Rate Climbs to 10.5 Percent (March 2009)
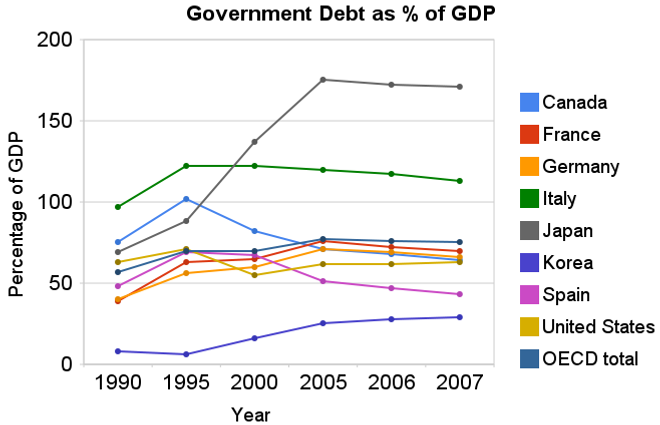 Chart showing government debt as a percentage of GDP by Curious Cat Investing Economics Blog, Creative Commons Attribution, data from OECD, Sept 2009.
For 2007 most countries slightly decreased their government debt to GDP ratio – as economic growth exceeded debt growth. The OECD is made up of countries in Europe and the USA, Japan, Korea, Australia, New Zealand and Canada. The overall OECD debt to GDP ratio decreased from 77% in 2005 to 75% in 2007. The USA moved in the opposite direction increasing from 62% to 63%: still remaining far below the OECD total. Most likely 2008, 2009 and 2010 will see both the USA and other OECD national dramatically increase the debt burden.
Compared to the OECD countries the USA is actually better than average. The chart shows the percentage of GDP that government debt represents for various countries. The USA ended 2007 at 63% while the overall OECD total is 75%. In 1990 the USA was at 63% and the OECD was at 57%. Japan is the line way at the top with a 2007 total of 171% (that is a big problem for them). Korea is in the best shape at just a 29% total in 2007 but that is an increase from just 8% in 1990.
Related: Government Debt as a Percentage of GDP Through 2006 – Oil Consumption by Country in 2007 – Federal Deficit To Double This Year – Politicians Again Raising Taxes On Your Children – True Level of USA Federal Deficit – Top 12 Manufacturing Countries in 2007
Read more
Welcome to the Curious Cat Investing and Economics Carnival, we hope you enjoy the following posts we share here.
- Does Earning More Trump Frugality? – “Which way is better? I think there’s a different answer for each person, actually. For some people, the bird in the hand is better – if you have a career that isn’t helped by such networking, for example. For others, building your presence might be more valuable than a frugality task.”
- Existing Home Sales Far Worse Than Advertised by Barry Ritholtz – “While the very worst of housing trouble may be behind us, we are still looking at falling prices and increasing foreclosures. The Housing getting worse more slowly camp is ignoring the massive Federal subsidies required to get worse more slowly.”
- Loan Delinquency Rates Increased Dramatically in the 2nd Quarter by John Hunter – “Default rates on commercial (up another 151 basis points) and residential (up 93 basis points) real estate continued to increase dramatically in the second quarter. Credit card default rates increased but only by 20 basis points.”
- Don’t Bet On A V-shaped Economy Recovery – “Banks’ restrictive lending, unemployment, stagnant wages and falling home values resulted in reluctance of households to borrow money for spending. With debt weary US consumers (which accounts for 70% US GDP), the US economy and export markets will not be in a hurry to rush into a V-shaped recovery even as the recession eases.”
- Tips for Managing Your 401k Plan by Patrick – “Max out company match. If your company offers matching contributions, then you should contribute at least the amount of the full company match if you can afford it. The company match is part of your benefits package and is essentially free money.”
- Deciphering the GDP Numbers by Philip – “Federal Spending: Federal Spending grew 10.9%, as compared with a drop of 3% in the previous quarter. This number tells you what a big cushion the economy got from the various stimulus programs that the government ran. Without the stimulus, the numbers would have been much worse than they were”