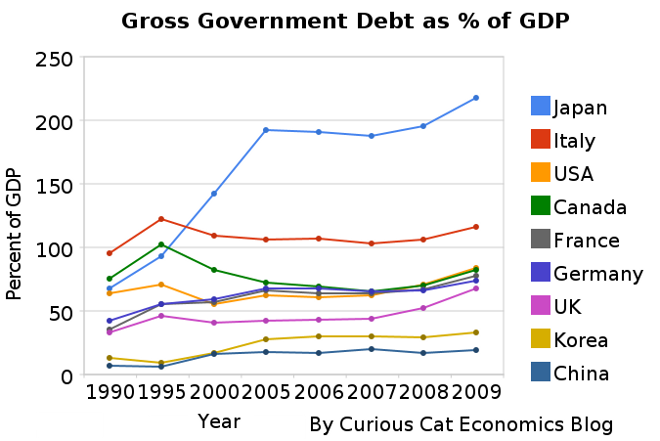
The world today has a much different economic landscape than just 20 years ago. China’s amazing economic growth is likely the biggest story. But the overwhelming success of many other countries is also a huge story. Today it is not the developing world that has governments spending taxes they promise their grandchildren will pay, but instead the richest countries on earth that choose to spend today and pay tomorrow. While “developing” countries have well balanced government budgets overall.
 The chart shows gross government debt as percentage GDP from 1990-2009. By Curious Cat Investing and Economics Blog, Creative Commons Attribution. Data source: IMF
___________________________
There are plenty of reasons to question this data but I think it gives a decent overall picture of where things stand. It may seem like government debt should be an easy figure to know but even just agreeing what would be the most reasonable figure for one country is very difficult, comparing between countries gets even more difficult and the political pressures to reduces how bad the data looks encourages countries to try and make the figures look as good as they can.
The poster child for irresponsible spending is Japan which has gross government debt of 218% of GDP (Japan’s 2009 figure is an IMF estimate). Greece is at 115%. Gross debt is not the only important figure. Government debt held within the country is much less damaging than debt held by those outside the country. Japan holds a large portion of its own debt. If foreigners own your debt then debt payments you make each year are paid outside your country and it is in essence a tax of a portion of your economic production that must be paid. If the debt is internal it mean taxpayers have to support bond holders each year (but at least when those bondholders spend the money it stays within your economy).
The USA debt stood at 64% in 1990, 71% in 1995, 55% in 2000, 61% in 2005, 71% in 2008 and 84% in 2009. Most rich countries saw significant increases in 2009 and will again in 2010. The IMF sees the USA going to 93% in 2010 and 103% in 2012. They see Germany at 75% in 2010 and 77% in 2012. They see the Greece increasing to 144% in 2012 and Japan to 239%.
Hong Kong has maintained gross government debt under 2% every year. Taiwan was 35% in 2005 and 40% in 2009, IMF estimates they will be at 37% in 2012. Singapore was 93% in 2005, 106% in 2009 with an estimate for 93% in 2012. Brazil had a 69% debt level in 2005, 69% in 2009 and the IMF has a 2012 estimate of 66%. Mexico had a 40% level in 2005, 45% in 2009 and is estimated to stay at 45% in 2012. Thailand, Turkey, Venezuela are under 50%; Malaysia and Argentina are under 60%. India was at 79% in 2005, 74% in 2009 and is estimated to be at 71% in 2012.
Related: Government Debt as Percentage of GDP 1990-2008 – USA, Japan, UK… – USA State Governments Have $1,000,000,000,000 in Unfunded Retirement Obligations – The USA Economy Needs to Reduce Personal and Government Debt – Oil Consumption by Country in 2007
Gross debt consists of all liabilities that require payment or payments of interest and/or principal by the debtor to the creditor at a date or dates in the future. This includes debt liabilities in the form of SDRs, currency and deposits, debt securities, loans, insurance, pensions and standardized guarantee schemes, and other accounts payable. Thus, all liabilities in the GFSM 2001 system are debt, except for equity and investment fund shares and financial derivatives and employee stock options. Debt can be valued at current market, nominal, or face values (GFSM 2001, paragraph 7.110).
Comments
2 Comments so far
Greece has been over 100% since 1998 and now stands at 148%, 2nd worst (to Japan) for any OECD country (Europe, North America, Japan and Korea), Italy is 3rd…
[…] Government Debt as Percent of GDP 1998-2010 for OECD – Gross Government Debt as Percentage of GDP 1990-2009: USA, Japan, Germany, China – Chart of Largest Petroleum Consuming Countries from 1980 to 2010 – Top Countries For […]