Looking at stock market capitalization by country gives some insight into how countries, and stocks, are doing. Looking at the total market capitalization by country doesn’t equate to the stock holdings by individuals in a country or the value of companies doing work in a specific country. Some countries (UK and Hong Kong, for example) have more capitalization based there than would be indicated by the size of their economy.
It is important to keep in mind the data is in current USA dollars, so big swings in exchange rates can have a big impact (and can cause swings to be exacerbated when they move in tandem with stock market movements – if for example the market declines by 15% and the currency declines by 10% against the US dollar those factors combine to move the result down).

The chart shows the top four countries based on stock market capitalization, with data from 200 to 2012. The chart created by Curious Cat Investing and Economics Blog may be used with attribution. Data from the World Bank.
As with so much recent economic data China’s performance here is remarkable. China grew from 1.8% of world capitalization in 2000 to 6.9% in 2012. And Hong Kong’s data is reported separately, as it normally is with global data sets. Adding Hong Kong to China’s totals would give 3.7% in 2000 with growth to to 8.9% in 2012 (Hong Kong stayed very stable – 1.9% in 2000, 2% in 2012). China alone (without HK) is very slightly ahead of Japan.
The first chart shows the largest 4 market capitalizations (2012: USA $18.6 trillion, China and Japan at $3.7 trillion and UK at $3 trillion). Obviously the dominance of the USA in this metric is quite impressive the next 7 countries added together don’t quite reach the USA’s stock market capitalization. I also including the data showing the global stock market capitalization divided by 3 (I just divide it by three to have the chart be more usable – it lets us see the overall global fluctuations but doesn’t cram all the other data in the lower third of the chart).
Canada is the 5th country by market capitalization (shown on the next chart) with $2 trillion. From 2000 to 2012 China’s market capitalization increased by $3.1 trillion. The USA increased by $3.6 trillion from a much larger starting point. China increased by 536% while the USA was up 23.5%. The world stock market capitalization increased 65% from 2000 to 2012.
Related: Stock Market Capitalization by Country from 1990 to 2010 – Government Debt as Percent of GDP 1998-2010 – Manufacturing Output by Country 1999-2011: China, USA, Japan, Germany
Fed Continues Adding to Massive Quantitative Easing
In fact, while the Fed has pumped about $2.8 trillion into the financial system through nearly five years of asset buying.
Bank excess reserves deposited with the New York Fed have mushroomed from less than $2 billion before the financial crisis to $2.17 trillion today. In essence, roughly two-thirds of the money the Fed pumped into the banking system never left the building.
The Fed now pays banks for their deposits. These payment reduce the Fed’s profits (the Fed send profits to the treasury) by paying those profits to banks so they can lavish funds on extremely overpaid executives that when things go wrong explain that they really have no clue what their organization does. It seems very lame to transfer money from taxpayers to too-big-to-fail executives but that is what we are doing.
Quantitative easing is an extraordinary measure, made necessary to bailout the too-big-to-fail institutions and the economies they threatened to destroy if they were not bailed out. It is a huge transfer payment from society to banks. It also end up benefiting anyone taking out huge amounts of new loads at massively reduced rates. And it massively penalizes those with savings that are making loans (so retirees etc. planing on living on the income from their savings). It encourages massively speculation (with super cheap money) and is creating big speculative bubbles globally.
This massive intervention is a very bad policy. The bought and paid for executive and legislative branches that created, supported and continue to nurture the too-big-to-fail eco-system may have made the choice – ruin the economy for a decade (or who knows how long) or bail out those that caused the too-big-to-fail situation (though only massively bought and paid for executive branch could decline to prosecute those that committed such criminally economically catastrophic acts).
The government is saving tens of billions a year (maybe even hundred of billions) due to artificially low interest rates. To the extent the government is paying artificially low rates to foreign holders of debt the USA makes out very well. To the extent they are robbing retirees of market returns it is just a transfer from savers to debtors, the too-big-to-fail banks and the federal government. It is a very bad policy that should have been eliminated as soon as the too-big-to-fail caused threat to the economy was over. Or if it was obvious the bought and paid for leadership was just going to continue to nurture the too-big-to-fail structure in order to get more cash from the too-big-to-fail donors it should have been stopped as enabling critically damaging behavior.
It has created a wild west investing climate where those that create economic calamity type risks are likely to continue to be rewarded. And average investors have very challenging investing options to consider. I really think the best option for someone that has knowledge, risk tolerance and capital is to jump into the bubble created markets and try to build up cash reserves for the likely very bad future economic conditions. This is tricky, risky and not an option for most everyone. But those that can do it can get huge Fed created bubble returns that if there are smart and lucky enough to pull off the table at the right time can be used to survive the popping of the bubble.
Maybe I will be proved wrong but it seems they are leaning so far into bubble inflation policies that the only way to get competitive returns is to accept the bubble nature of the economic structure and attempt to ride that wave. It is risky but the supposedly “safe” options have been turned dangerous by too-big-to-fail accommodations.
Berkshire’s Munger Says ‘Venal’ Banks May Evade Needed Reform (2009)
Related: The Risks of Too Big to Fail Financial Institutions Have Only Gotten Worse – Is Adding More Banker and Politician Bailouts the Answer? – Anti-Market Policies from Our Talking Head and Political Class
A report by the Dallas Federal Reserve Bank, Assessing the Costs and Consequences of the 2007–09 Financial Crisis and Its Aftermath, puts the costs to the average household of the great recession at $50,000 to $120,000.
The worst downturn in the United States since the 1930s was distinctive. Easy credit standards and abundant financing fueled a boom-period expansion that was followed by an epic bust with enormous negative economic spillover.
…
Our bottom-line estimate of the cost of the crisis, assuming output eventually returns to its pre-crisis trend path, is an output loss of $6 trillion to $14 trillion. This amounts to $50,000 to $120,000 for every U.S. household, or the equivalent of 40 to 90 percent of one year’s economic output.
They say “misguided government incentives” much of which are due to payments to politicians by too-big-to-fail institution to get exactly the government incentives they wanted. There is a small bit of the entire problem that is likely due to the desire to have homeownership levels above that which was realistic (beyond that driven by too-big-to-fail lobbyists).
“Were safer” says a recent economist. Which I guess is true in that it isn’t quite as risky as when the too-big-to-fail-banks nearly brought down the entire globally economy and required mass government bailouts that were of a different quality than all other bailouts of failed organizations in the past (not just a different quantity). The changes have been minor. The CEOs and executives that took tens and hundreds of millions out of bank treasures into their own pockets then testified they didn’t understand the organization they paid themselves tens and hundreds of a millions to “run.”
We left those organizations intact. We bailed out their executives. We allowed them to pay our politicians in order to get the politicians to allow the continued too-big-to-fail ponzie scheme to continue. The too-big-to-fail executives take the handouts from those they pay to give them the handouts and we vote in those that continue to let the too-big-to-fail executives to take millions from their companies treasuries and continue spin financial schemes that will either work out in which case they will take tens and hundreds of millions into their person bank accounts. Or they won’t in which case they will take tens of millions into their personal bank accounts while the citizens again bail out those that pay our representatives to allow this ludicrous system to continue.
At the close of business this Friday Goldman Sachs, Visa and Nike will be added to Dow Jones Industrial Average (DJIA) and HP, Alcoa and Bank of America will be dropped. The DJIA is a not something that deserves attention in my opinion, but it gets it. The index of 30 large stocks is less useful than say the S & P 500 Index with I prefer.
The “industrial” heritage (represented by the name) is still visible but as the economy has changed the makeup of stocks has moved to reflect the growing importance of services.
The 30 stocks in the DJIA will be:
- American Express Company – AXP
- AT&T – T
- Boeing – BA
- Caterpillar – CAT
- Chevron – CVX
- Citigroup – C
- Coca-Cola – KO
- Du Pont – DD
- Exxon Mobil – XOM
- General Electric Company – GE
- General Motors – GM
- Goldman Sachs – GS
- Home Depot – HD
- Intel – INTC
- International Business Machines – IBM
- Johnson & Johnson – JNJ
- J. P. Morgan Chase – JPM
- Kraft Foods – KFT
- McDonald’s – MCD
- Merck – MRK
- Microsoft – MSFT
- Minnesota Mining & Manufacturing – MMM
- Nike – NIKE
- Pfizer – PFE
- Procter & Gamble – PG
- United Technologies – UTX
- Verizon Communications – VZ
- Visa – V
- Wal-Mart Stores – WMT
- Walt Disney – DIS
Global wind power capacity has increased 391% from 2005 to 2012. The capacity has grown to over 3% of global electricity needs.
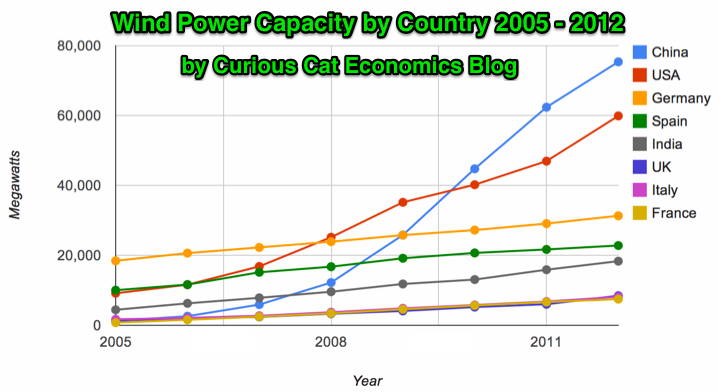
Chart by Curious Cat Economics Blog using data from the Wind Energy Association. Chart may be used with attribution as specified here.
The 8 countries shown on the chart account for 82% of total wind energy capacity globally. From 2005 to 2012 those 8 countries have accounted for between 79 and 82% of total capacity – which is amazingly consistent.
Japan and Brazil are 13th and 15th in wind energy capacity in 2012 (both with just over one third of France’s capacity). Japan has increased capacity only 97% from 2005 to 2012 and just 13% from 2010 to 2012. Globally wind energy capacity increased 41% from 2010 to 2012. The leading 8 countries increased by 43% collectively lead by China increasing by 68% and the USA up by 49%. Germany added only 15% from 2010 through 2012 and Spain just 10%.
Brazil has been adding capacity quickly – up 170% from 2010 through 2012, by far the largest increase for a county with significant wind energy capacity. Mexico, 24th in 2012, is another country I would expect to grow above the global rate in the next 10 years (I also expect Brazil, India and Japan to do so).
In 2005 China accounted for 2% of wind energy capacity globally they accounted for 30% in 2012. The USA went from 15% to 24%, Germany from 31% to 12%, Spain from 17% to 9% and India from 8% to 7%.
Related: Global Wind Energy Capacity Exceeds 2.5% of Global Electricity Needs (2011) – Nuclear Power Generation by Country from 1985-2010 – Chart of Wind Power Generation Capacity Globally 2005 to 2012 (through June)