This richest 1% continue to take advantage of economic conditions to amass more and more wealth at an astonishing rate. These conditions are perpetuated significantly by corrupt politicians that have been paid lots of cash by the rich to carry out their wishes.
One thing people in rich countries forget is how many of them are in the 1% globally. The 1% isn’t just Bill Gates and Warren Buffett. 1% of the world’s population is about 72 million people (about 47 million adults). Owning $1 million in assets puts you in the top .7% of wealthy adults (Global Wealth Report 2013’ by Credit Suisse). That report has a cutoff of US $798,000 to make the global 1%. They sensibly only count adults in the population so wealth of $798,000 puts you in the top 1% for all adults.
$100,000 puts you in the top 9% of wealthiest people on earth. Even $10,000 in net wealth puts you in the top 30% of wealthiest people. So while you think about how unfair it is that the system is rigged to support the top .01% of wealthy people also remember it is rigged to support more than 50% of the people reading this blog (the global 1%).
I do agree we should move away from electing corrupt politicians (which is the vast majority of them in DC today) and allowing them to continue perverting the economic system to favor those giving them lots of cash. Those perversions go far beyond the most obnoxious favoring of too-big-to-fail banking executives and in many ways extend to policies the USA forces on vassal states (UK, Canada, Australia, France, Germany, Japan…) (such as those favoring the copyright cartel, etc.).
Those actions to favor the very richest by the USA government (including significantly in the foreign policy – largely economic policy – those large donor demand for their cash) benefit the global 1% that are located in the USA. This corruption sadly overlays some very good economic foundations in the USA that allowed it to build on the advantages after World War II and become the economic power it is. The corrupt political system aids the richest but also damages the USA economy. Likely it damages other economies more and so even this ends up benefiting the 38% of the global .7% that live in the USA. But we would be better off if the corrupt political practices could be reduced and the economy could power economic gains to the entire economy not siphon off so many of those benefits to those coopting the political process.
The USA is home to 38% of top .7% globally (over $1,000,000 in net assets).
| country | % of top .7% richest | % of global population |
|---|---|---|
| USA | 38.3% | 4.5% |
| Japan | 8.6% | 1.8% |
| France | 7.5% | .9% |
| UK | 6.1% | .9% |
| Germany | 5.9% | 1.1% |
| other interesting countries | ||
| China | 3.4% | 19.2% |
| Korea | 1% | .7% |
| Brazil | .6% | 2.8% |
| India | .5% | 17.5 |
| Indonesia | .3% | 3.5% |
Oxfam published a report on these problems that has some very good information: Political capture and economic inequality
…
Since the late 1970s, weak regulation of the role of money in politics has permitted wealthy individuals and corporations to exert undue influence over government policy making. A pernicious result is the skewing of public policy to favor elite interests, which has coincided with the greatest concentration of wealth among the richest one percent since the eve of the Great Depression.
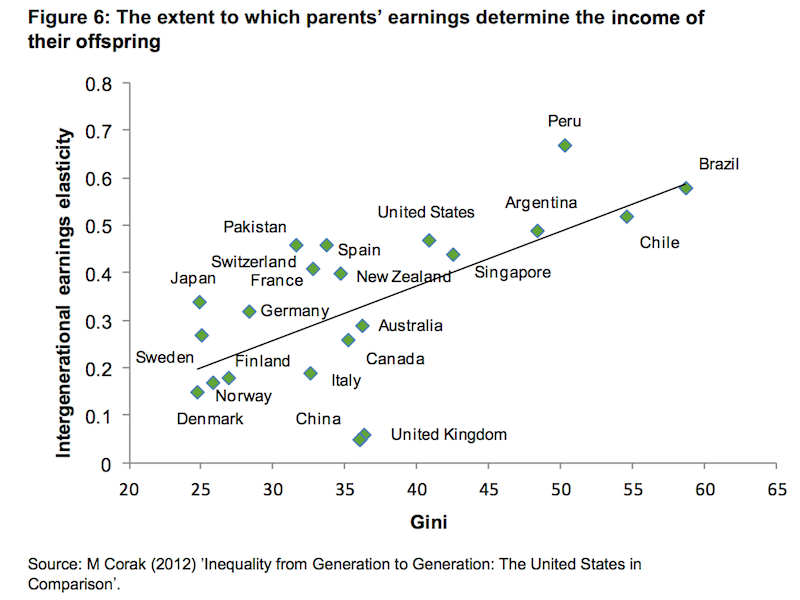
The chart shows the correlation between kids and parents income and income inequality for each country listed. The more income inequality the more rigid the economic system is. Those countries with huge amounts of income inequality create economic systems to insure those that have rich parents are rich themselves.
At the least trust fund baby country cultures you have Scandinavian countries. The USA has been moving to an increasingly trust fund baby focus over the last few decades with the expected increase in kids incomes being more related to their parents income than any other factor. In the USA now nearly 50% of someone’s income can be “explained” by their parents income. That is the math showing how income is correlated to factors (such as college education, degree type…) shows that 50% of the kids income can be calculated just using the parent’s income.
That is obviously a very anti-capitalist system. It is the essentially a nobility based system of kids inheriting their place in society instead of earning it. I have written numerous times about this corruption of the word capitalism by the talking heads and politicians in the USA being used to justify corruption. For example, in these posts: We Need to be More Capitalist and Less Cronyist, Anti-Market Policies from Our Talking Head and Political Class and Not Understanding Capitalism.
The corrupt political system adopting economic policy that favors those giving cash to politicians is very bad for our economy and society. We can change this by not electing corrupt politicians but we don’t seem even remotely interested in doing so. Until that changes the corruption system will continue to damage our society, country and world.
If we are lucky we will reduce the level of corruption in the the political parties in the USA and other rich countries. The level of corruption is likely to remain very high though. The rules are being made by those with cash to pay corrupt parties and only minor adjustments around the edges are able to blunt the full force of corruption. It would be wonderful if this corruption could be largely eliminated (such as petty corruption has largely, though there is still far too much, has been USA – bribes to get business license, bribes to avoid sanctions for unhealthy food preparation conditions, etc.).
The current system largely favors the very wealthy and powerful that get special favors only available to them. One way to participate is in those companies that benefit from the current corrupt systems (cable TV, ISPs, too-big-to-fail-banks, copyright cartel industries, health care…). The biggest exception I think is too-big-to-fail banks. In the other industries the executives take large portions of shareholders profits, because then can, but they have some limits where shareholders will finally throw them out.
So the executives many times their fair share of the economic benefits due to the corruption in Washington DC but there is a large amount left for shareholders. In the too-big-to-fail banks the executives treat shareholders like their customers – fools to be fleeced at every opportunity. So they have hugely profitable businesses supported by bought and paid for politicians and bureaucrats but they then take so much of the profits that owning those companies seems unwise to me.
But for many other industries you can participate in the benefits provided by the corrupt political parties in the USA by owning stock in those businesses they provide favors to for piles of cash. You don’t make the .01% global rich list by working hard and a normal job and saving 15% of your income. But you can make the 1% global rich list by doing that with a median income job in the USA (and most other rich countries). It might not be glamorous and you might be jealous of those that are better at exploiting the corruption to get ahead, but you still are better off than 99 our of 100 people economically. That is hardly something worth pity.
Now if your parents are poor you are going to have a much harder time getting to the point where you get a job where you earn a median USA income. It would be better if the USA improved a great deal, but even so, there are very few (if any) places you are better off being born (economically) than the USA. Of course, being born rich in a country like the USA where we elect politicians to create trust fund baby economic policies is even more lucky than just being born in the USA.
Related: Cash for Votes subreddit – Economic Fault: Income Inequality – How Economic Inequality Harms Societies – The Aim of Modern Day Political Parties in the USA is To Scare Donors Into Giving Cash – Rich Americans Sue to Keep Evidence of Their Tax Evasion From the Justice Department
Comments
1 Comment so far
Whaoo! Is this true? The inequality gap is too wide. Can this trend change? And unfortunately, the rich make the rule.