The total stock market capitalization by country gives some insight but it is also data that is a bit muddy. The data doesn’t tell you how the economies of the countries are doing as there is quite a bit of room for misinterpreting the data.
Apple, Alphabet, Intel, 3M, Abbvie… all are included in the USA market capitalization but much of their sales, earnings and employment are overseas. And USA companies have done very well in global markets so the USA totals are not just an indication how the USA has performed but includes great gains made by profiting from global growth. Also you may be surprised to learn that 26% of USA equities are owned by investors outside the USA.

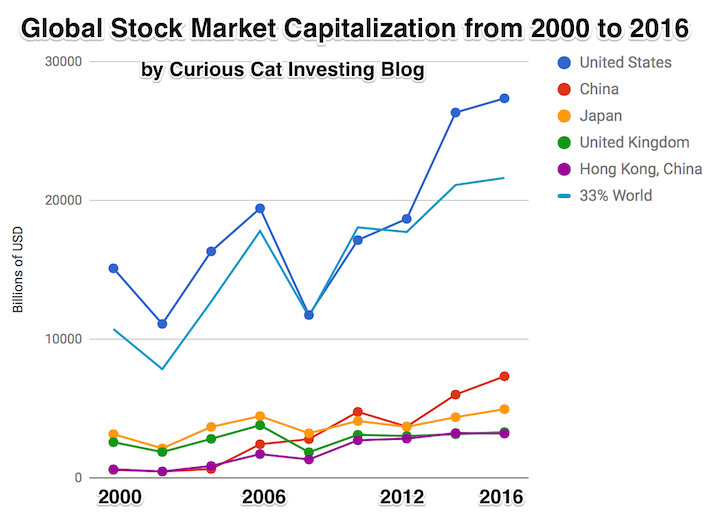
The chart shows the top countries based on stock market capitalization, with data from 2000 to 2016. The chart was created by Curious Cat Investing and Economics Blog may be used with attribution. Data from the World Bank.
It is important to keep in mind the data is shown in current USA dollars, so large swings in exchange rates can have a large impact.
China’s performance has been remarkable. China also shows some of the challenges in collecting this data. I am fairly certain Alibaba (BABA), one of the 10 most valuable companies in the world and a Chinese company has the stock issued in the USA (even this is confusing as it is a complex arrangement but the only publicly traded stock is traded in the USA). And many other Chinese companies are traded this way and therefore are not included in the Chinese total value. In addition Hong Kong is part of China but also separate. The data is reported separately by the world bank and I include them that way in the charts.
As with so much recent economic data China’s performance here is remarkable. China grew from 1.8% of world capitalization in 2000 to 6.9% in 2012 and 11.2% in 2016. Adding Hong Kong to China’s totals shows 3.7% in 2000 with growth to to 12.2% in 2012 and 16.2% in 2016. If you look at my post global stock market capitalization from 2000 to 2012 you will see significantly different historical data for Hong Kong. Collecting this data is much more complex than people realize and data determinations can change over the years resulting in changes in historical data.
The chart shows the 1/3 of the total global market capitalization in order to have the chart display look better (and it also makes it easier to compare the USA performance to the total global performance). The USA market capitalization was at 46.9% of the global market cap in 2000 and fell to 31.6% in 2000 before rising to 42% in 2016. This shows that the USA has largely held its own globally as measured by market cap. This may not seem impressive but when you consider that China has grown from 3.7% to 16.2% you can see that for the market cap outside of China the USA has actually gained quite a bit of ground. This is the result of what I mentioned before – how well USA companies have done at capture global markets (especially in high technology areas with very high profits and therefore very high market caps).