The most popular posts on the Curious Cat Investing and Economics blog in 2018 (based on page views).
- Default Rates on Loans by Credit Score (2015)
- Stock Market Capitalization by Country from 2000 to 2016 (2017)
- Stock Market Capitalization by Country from 1990 to 2010 (2012)
- The 20 Most Valuable Companies in the World – November 2017
- USA Household Debt Jumps to Record $13.15 Trillion (2018)*
- Save What You Can, Increase Savings as You Can Do So (2012)*
- Top 10 Countries for Manufacturing Production in 2010: China, USA, Japan, Germany… (posted in 2011)
- Government Debt as Percentage of GDP 1990-2009: USA, Japan, Germany, China… (2010)
- Manufacturing Output as a Percent of GDP by Country (1980 to 2008) (2010)
- “Explaining” Random Variation in Financial Data (2018)*

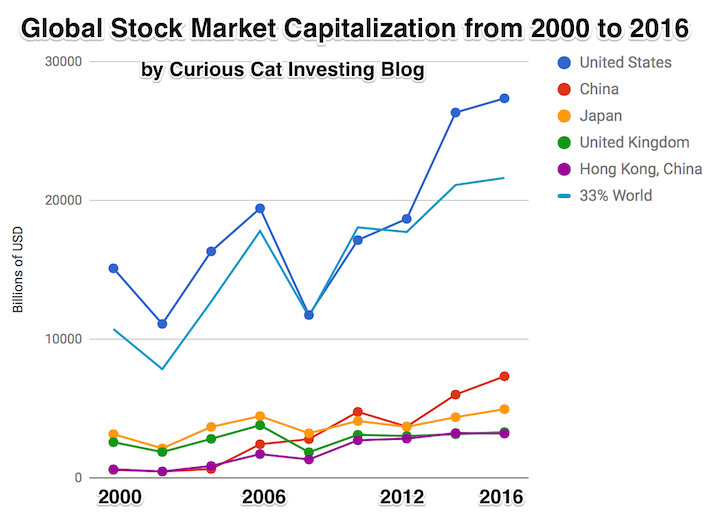
The chart shows the top countries based on stock market capitalization, with data from 2000 to 2016. The chart was created by Curious Cat Investing and Economics Blog may be used with attribution. Data from the World Bank.
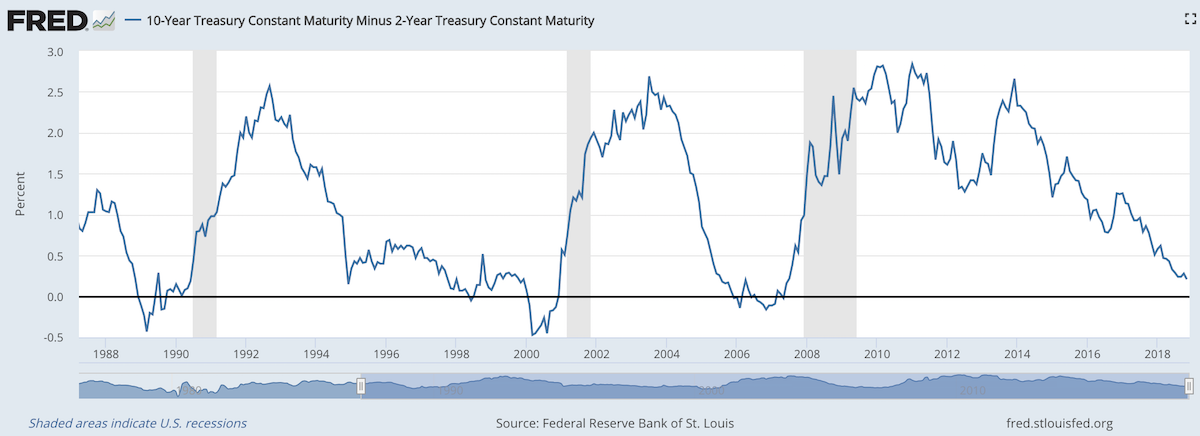
When 2 year US government bonds yield more than the 10 year US government bonds a recession is likely to appear soon. This chart shows why this is seen as such a reliable predictor.

The chart shows the 10 year yield minus the 2 year yield. So when the value falls below 0 that means the 2 year yield is higher. Each time that happened, since 1988, a recession has followed (the grey shaded areas in the chart).
Do note that there were very small inversions in 1998 and 2006 that did not result in a recession in the near term. Also note that in every case the yield curve was no longer inverted by the time a recession actually started.
The reason why this phenomenon is getting so much attention recently is another thing that is apparent when looking at this chart, the 2 and 10 year yields are getting close to equal. But you can also see we are no closer than 1994 and the USA economy held off a recession for 7 more years.
Since 1970 the average length of time from the inversion of the 10 to 2 year yield curve has been 12 months (with a low of 6 months in 1973 and a high of 17 months, before the great recession of 2008).
In addition to a possibly impending yield curve inversion it has been a long time since the last recession which makes many investors and economists nervous that one may be due.
Related: 30 Year Fixed Mortgage Rates are not correlated with the Fed Funds Rate – Bond Yields Stay Very Low, Treasury Yields Drop Even More (2010) – Looking for Dividend Stocks in the Current Extremely Low Interest Rate Environment (2011) – Stock Market Capitalization by Country from 2000 to 2016
Another thing to note about yield curves at this time is that the US Federal Reserve continues to hold an enormous amount of long term government debt (trillions of dollars) which it has never done before the credit crisis of 2008. This reduces the long term yield since if they sold those assets that would add a huge amount of supply. How this impacts the predictive value of this measure will have to be seen. Also, one way for the Fed to delay the inversion would be to sell some of those bonds and drive up long term rates.