400 million people in India and 1.2 billion people worldwide do not have electric power at home. Mera Gao Power provides a wonderful market solution. Mera Gao Power can install solar power systems at a low cost that can be paid back in just 2 years by charging only 50 cents a month to users (for 7 hours of electricity a day). So they provide funding (through investors and grants) and recoup the investment quickly by providing a valuable service at a price users can afford.
Four solar panels are sufficient to power an entire village of 100 households with quality light and mobile charging. These panels are installed on the roofs of existing households, thus eliminating the need for land. Since power is generated during the day and used at night they use batteries to store the power.
By utilizing LED lights, MGP’s micro grid design is ultra energy efficient. This is the key to reducing power generation and storage equipment. Each household is provided with two or four LED lights.
Mera Gao Power received funding from USAID Development Innovation Ventures. The video presents their innovation for a village-level solar micro grid to electrify rural Uttar Pradesh for a White House meeting.
Related: Appropriate Technology: Solar Water Heaters in Poor Cairo Neighborhoods – Top Countries For Renewable Energy Capacity – Water Pump Merry-go-Round – Letting Children Learn, Hole in the Wall Computers – Homemade Windmills for Electricity – Water and Electricity for All
The economics of solar energy make sense today. The main stumbling block is financing the initial purchase (for homeowners, businesses or utilities). For new power generation solar is economically competitive in many locations today and prices continue to decline. One aspect that has harmed financing is the historical depreciation has been high (assuming a short lifespan of solar panels) but the panels now have much longer lifespans, meaning that when computing the return of solar investments you can expect a longer payback period. Combine that with falling prices and the economic case is great.
For a homeowner there is still the problem of financing what could be a $30,000 installation. Of course, the extremely low interest rates help here. First you have low cost capital (when calculating your return). Second, your alternative yields are very low (so it isn’t like you would earn 8% on your money just buying a CD). But for those that don’t want to take on the loan many companies are being formed to work on the financing for you (they deal with financing and then sell you the electricity they generate with panels on your home). It is a good business model I think. I personally think you are better off cutting out the intermediary and financing it yourself, but if you don’t want to, you can get cheaper electricity and help the environment.
In the USA there is a 30% federal tax credit for solar installation. Several states also offer tax credits for solar installation. There are also incentives in many other countries including Japan, Germany, Spain, Italy…
Where the U.S. Solar Industry Is Shining
…
Developers in the U.S. added 449.2 megawatts of solar-generating capacity in the third quarter of 2011, the latest data available, up 140 percent from the same quarter a year earlier.
…
SunRun hires local companies in 10 states to install solar arrays on customers’ roofs. The company charges clients for the electricity they generate— at monthly rates as much as 15 percent below those of regular utilities. Jurich says she expects SunRun to have a presence in 15 to 20 states within five years.
I own JinkoSolar stock which manufactures solar panels. This is based on the belief that solar has reached a point where it is a good way to generate electricity and we have huge needs for electrical power generation world wide.
Related: Top Countries For Renewable Energy Capacity – Global Wind Energy Capacity Exceeds 2.5% of Global Electricity Needs – Solar Energy: Economics, Government and Technology – Oil Consumption by Country 1990-2009
 Chart by Curious Cat Economics Blog using data from the Wind Energy Association. 2011 data is for the capacity on June 30, 2011. Chart may be used with attribution as specified here.
_________________________
In 2007 wind energy capacity reached 1% of global electricity needs. In just 4 years wind energy capacity has grown to reach 2.5% of global electricity demand. And by the end of 2011 it will be close to 3%.
By the end of 2011 globally wind energy capacity will exceed 240,000 MW of capacity. As of June 30, 2011 capacity stood at 215,000. And at the end of 2010 it was 196,000.
As the chart shows Chinese wind energy capacity has been exploding. From the end of 2005 through the end of 2011 they increased capacity by over 3,400%. Global capacity increased by 233% in that period. The 8 countries shown in the chart made up 79% of wind energy capacity in 2005 and 82% at the end of 2010. So obviously many of other countries are managing to add capacity nearly as quickly as the leading countries.
USA capacity grew 339% from 2005 through 2010 (far below China but above the global increase). Germany and Spain were leaders in building capacity early; from 2005 to 2010 Germany only increased 48% and Spain just 106%. Japan is an obvious omission from this list; given the size of their economy. Obviously they have relied heavily on nuclear energy. It will be interesting to see if Japan attempts to add significant wind and solar energy capacity in the near future.
Related: Nuclear Power Production by Country from 1985-2009 – Top Countries For Renewable Energy Capacity – Wind Power Capacity Up 170% Worldwide from 2005-2009 – USA Wind Power Installed Capacity 1981 to 2005 – Oil Consumption by Country 1990-2009

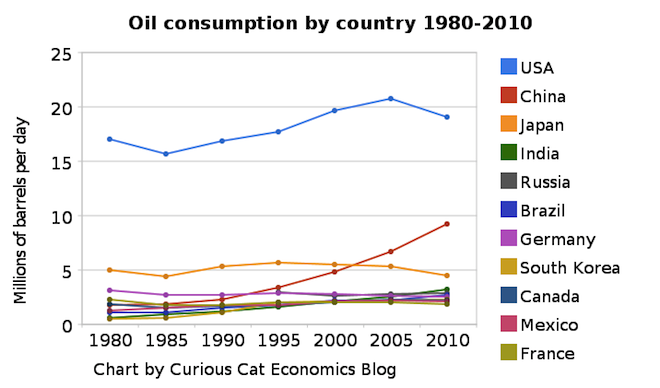
Chart of petroleum consumption by country 1980-2010 by the Curious Cat Investing and Economics Blog. The chart may be used with attribution.
The USA remains, by a huge margin, the largest consumer of petroleum products (motor gasoline, jet fuel, liquefied petroleum gases, residential fuel oil…) using 22% of the total (with about 4.5% of the population). From 1980 to 2010 the global consumption increased 38% to 87 million barrels a day.
From 1980 to 2010 USA consumption increased 12% (so less than global consumption). Meanwhile, Germany, Japan and France decreased petroleum use by 19%, 17% and 10% respectively. Many countries have very low use in 1980 and have grown their economies dramatically over this period and increased petroleum use dramatically also: India up 433%, China up 411%, South Korea up 360%.
Africa, in total, used 3.3 million barrels a day in 2010, up 120% from 1980. Africa used 73% of what Japan used in 2010 and 17% of what the USA used and 50% more than Canada. The data shows no sign of declining petroleum consumption on a global basis. The USA uses as much as China, India, Brazil and Africa combined. I believe, in 2015 those countries (by which I mean all the countries in Africa too, not that Africa is a country, which of course it is not) will use more than the USA (and likely show significant growth from 2010 levels).
Data is from the US Energy Information Agency.
Related: Oil Production by Country 1999-2009 – Top Countries For Renewable Energy Capacity – Chart of Nuclear Power Production by Country from 1985-2009 – Increasing USA Foreign Oil Dependence In The Last 40 years
I believe it is wise from an environmental and economic viewpoint to invest in renewable energy projects. I believe the costs of fossil fuel based energy will continue to increase. Renewable energy is continuing to improve and when considering the negative externalities caused by oil, gas and coal and the continuing improvement in wind, solar and geothermal generation investment in renewable energy are going to payoff well for countries.
| Top countries for installed renewable energy capacity | ||
|---|---|---|
| Rank | Country | Capacity (GigaWatts) |
| 1 | China | 103.4 |
| 2 | USA | 58.0 |
| 3 | Germany | 48.9 |
| 4 | Spain | 27.8 |
| 5 | Japan | 26.0 |
| 6 | India | 18.7 |
| 7 | Italy | 16.7 |
| 8 | Brazil | 13.8 |
| 9 | France | 9.6 |
The largest increases in renewable energy capacity by country from 2005 to 2010 are: China (up 106%), South Korea (up 88%), Turkey (up 85%), Germany (up 67%), Italy and Japan (up 45%). All the data is from the Pew Clean Engery Program report: Who’s Winning the Clean Energy Race? (pdf).
…
India is poised to take a leadership role in the solar sector, with a target of deploying 20 GW by 2020. In 2010, the country set about getting its National Solar Mission in place by permitting 0.5 GW worth of large solar thermal capacity and a modest 150 MW worth of photovoltaic (PV) solar.
My guess is that the stimulus packages in several countries contributed greatly to the increases (notably Germany and Italy targeted green investments – as did China to some extent, in Wind Energy). Spain took a hit as debt levels caused the government to cut spending. I would imagine this is likely to happen in Italy (and was expected to happen in Germany – the extent of decreases is less certain after the earthquake in Japan).
Related: Chart of oil consumption by country from 1990-2009 – Wind Power Capacity Up 170% Worldwide from 2005-2009 – Japan to Add Personal Solar Subsidies (2008) – Chart of Top Nuclear Power Generating Countries from 1985 to 2009 – Wind Power has the Potential to Produce 20% of Electricity Supply by 2030
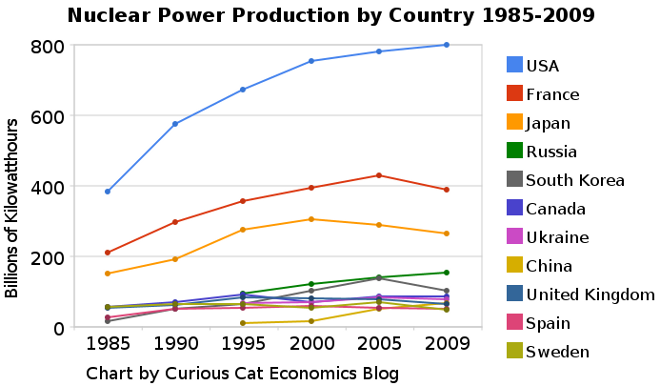
 The chart shows the leading nuclear power producing countries from 1985-2009. The chart created by Curious Cat Investing and Economics Blog may be used with attribution. Data from US Department of Energy.
___________________
Nuclear power provided 14% of the world’s electricity in 2009. Wind power capacity increased 170% Worldwide from 2005-2009, to a total of 2% of electricity used (38,025 Megawatts of capacity). The USA produced nearly twice as much electricity using nuclear power than any other country, which surprised me.
Another view of data on nuclear power shows which of the leading nuclear producing countries have the largest percentages of their electrical generating capacity provided by nuclear power plants (as of 2009). France has 75% of all electricity generated from nuclear power. Ukraine had the second largest percentage at 49%, then Sweden at 37% and South Korea at 35%. Japan is at 28% compared to 20% for the USA (I am surprised these are so close _ would have thought France and Japan would be much closer). Russia is at 18% and China was at just 2%. As of January 2011, 29 countries worldwide are operating 442 nuclear reactors for electricity generation and 65 new nuclear plants are under construction in 15 countries. Source, Nuclear Energy Institute.
From 1985 to 2009, USA production increased 108%, France 84% and Japan up 77%. South Korea is up 550% (from a very low starting point). Globally nuclear power production increased 80% from 1985 to 2009. From 2000-2009 production increased 5% in the USA and decreased by 1% in France and 13% in Japan. China was up 318% (from a very low level) from 2000-2009 (they did not have nuclear power capacity prior to 1995.
The global capacity of nuclear power was scheduled to increase more rapidly in the future before the earthquake in Japan and the crisis at the Kashiwazaki-Kariwa Nuclear Power Plant. China was going to add a great deal of capacity and is likely to over the next few years (nuclear power plants take many year to bring online so those coming online in the next few years have already had hundreds of millions invested in building them). Several European countries have already announced temporary closing of some plants (especially some plants nearing the end of their originally scheduled lives – which those countries had been in the process of extending).
As a comparison global oil production increased by 10.5% from 1999-2009, while nuclear global production increased by 5% from 2000-2009. From 1999-2009 USA oil production decreased 7%. Russia increased production 62% in the decade, moving it into first place ahead of Saudi Arabia that increased production 10%.
Related: Oil Production by Country 1999-2009 – Oil Consumption by Country 1990-2009 – Japan to Add Personal Solar Subsidies – Solar Thermal in Desert, to Beat Coal by 2020
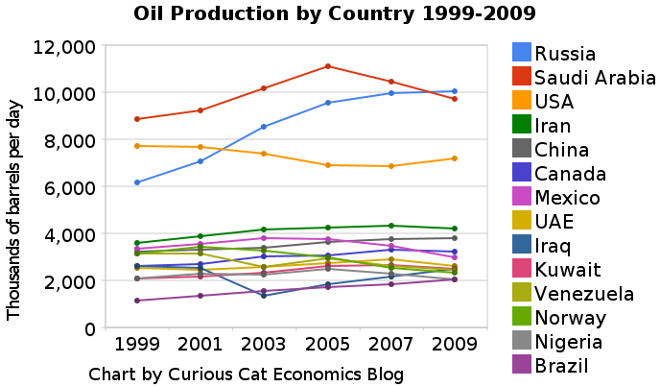
The chart shows the oil production over the last decade by the top oil producing countries. Production totals include crude oil, shale oil, oil sands and NGLs (the liquid content of natural gas where this is recovered separately). Excludes liquid fuels from other sources such as biomass and coal derivatives.
 The chart shows the leading oil producing countries from 1999-2009. The chart created by Curious Cat Investing and Economics Blog may be used with attribution.
___________________
The chart show 3 clear leaders in production Russia, Saudi Arabia and the USA (with the USA firmly in 3rd place). Those 3 were responsible for approximately a third of the total oil production in 2009. Russia greatly increased production. During the last decade world production increased from 72 million barrels a day to 80 million barrels a day. Russia accounted for 51% of the increase, close to 4 million barrels a day.
The next 11 countries are pretty closely grouped, with slightly increasing production over the period as a group. Brazil, the last country with over 2 million barrels of production a day in 2009, has the largest percentage increase in the period, producing 79% more in 2009 than they did in 1999. Russia increase production 62% over the period. The other countries ranged from a 23% increase (Canada) to a 25% decrease (Norway). The USA increased production 7% and China increased production 18%. World production increased 11%.
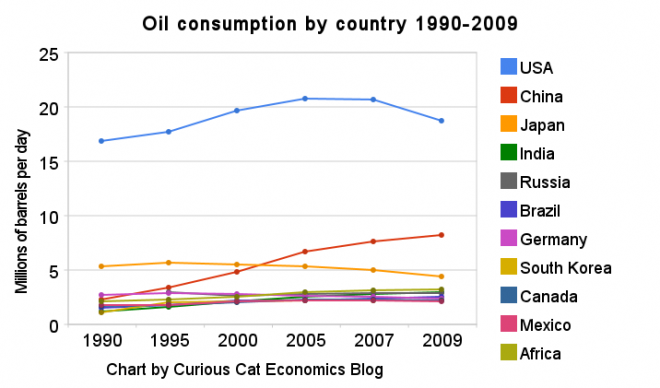
Last year I posted a chart showing oil consumption by the top oil consuming countries over the last 2 decades; showing all countries using over 2 million barrels of oil a day. The USA consumed 18.7 million barrels a day in 2009. Only China was also over 5 million barrels, using 8.2 million in 2009. Japan was next at 4.4 million.
Read more
The United States uses far more oil than any other country. The chart shows this very well. The chart shows all countries using over 2 million barrels of oil a day. The USA consumed 18.7 million barrels a day in 2009. Only China was also over 5 million barrels, they reached 8.2 million in 2009. Japan is next at 4.4 million.

The data is from the US Department of Energy for total consumption of petroleum products.
Mexico, Canada, South Korea, Germany, Brazil, Russia and India all use between 2 and 3 million barrels a day. All of Africa is at 3.2 million.
Related: Oil Consumption by Country in 2007 – Manufacturing output by Country 1990-2008 – Increasing USA Foreign Oil Dependence In The Last 40 years – Wind Power Capacity Up 170% Worldwide from 2005-2009
Where is George Soros investing? The SEC filings will tell you (as of March 31, 2010).
The fund holds over $600 million of Petrobas (Brazil Oil and Gas) (the fund bought about 1.4 million shares of the ADR in the quarter), $300 million of Hess (sold about 900,000 shares), $280 in Suncor Engery (bought over 1.5 million shares), $220 million of Monsanto (sold almost 700,00 shares), $190 of Interoil (bought over 150,000 shares), $175 million of Direct TV (bought 1,000,000 shares), $175 million of Verizon (bought 800,000 shares), $150 million of Plains Exploration and Production (sold 1.7 million shares), $140 million of Best Buy (bought 300,00 shares), $130 million of Novagold (bought 15 million shares, bringing to the total to almost 19 million), $120 million of Emdeon (selling over 1 million), $110 million of JP Morgan Chase (nearly all bought in this quarter) and $90 million of Pfizer (sold over 600,000 shares – over half the position). The fund owns a good deal of gold shares including over $600 million in SPDR gold trust shares (all bought this quarter). The total value of the fund was $8.75 billion. The fund own numerous convertible bond issues in excess of $100 million.
During the quarter the fund sold essentially all of Citigroup – over $300 million at the beginning of the quarter and nearly all of Ace Limited $75 million at the beginning of the quarter, and Lowes ($55 million). It sold 80% of Dana Holding ($60 million at the beginning of the quarter). It sold all of Bunge Limited – $66 million, and Terra Industries $100 million.
I am also overweight in Oil and Gas (the last 2 years is the first time I ever have been). The fund owns $20 million of ATP Oil and Gas, a speculative pick that I also own (the fund added 150,000 shares during the quarter). It also owns over $20 million of Brigham Exploration (fund sold 550,000 shares) another small oil and gas stock that I bought this year. And it has a bit over $40 million in Apple, $60 million in Yahoo $5 million in Amazon.
Related: Famous Stock Traders: Nicolas Darvas – Soros on Financial Crisis and Markets – 11 Stocks for 10 Years, March 2010 Update – Ten Stocks To Avoid
In his presentation Mike Milken explores foreign oil dependence for the USA and presidential statements:
President Richard Nixon (in 1974 with 36.1% of oil from foreign sources): “At the end of this decade, in the year 1980, the United States will not be dependent on any other country for the energy we need.”
President Gerald Ford (in 1975 with 36.1% of oil from foreign sources): “We must reduce oil imports by one million barrels per day by the end of this year and by two million barrels per day by the end of 1977.”
President Jimmy Carter (1979, 40.5%): “Beginning this moment, this nation will never use more foreign oil than we did in 1977 – never.”
President Ronald Reagan (1981, 43.6%): “While conservation is worthy in itself, the best answer is to try to make us independent of outside sources to the greatest extent possible for our energy.”
President George Bush (1992, 47.2%): “When our administration developed our national energy strategy, three principles guided our policy: reducing our dependence on foreign oil…”
President Bill Clinton (1995, 49.8%): “The nation’s growing reliance on imports of oil… threatens the nation’s security… [we] will continue efforts to…enhance domestic energy production.”
President George W. Bush (2006, 65.5%): “Breakthroughs…will help us reach another great goal: to replace more than 75 percent of our oil imports from the Middle East by 2025.”
President Barack Obama (2009, 66.2%) “It will be the policy of my administration to reverse our dependence on foreign oil while building a new energy economy that will create millions of jobs.”
Related: Oil Consumption by Country in 2007 – Google’s Energy Interests – South Korea To Invest $22 Billion in Overseas Energy Projects