USA health care spending continues to grow, consuming an ever increasing share of the economic production of the USA. USA health care spending is twice that of other rich countries for worse health care results.
- USA health care expenditures grew 3.9% to $2.7 trillion in 2011, or $8,680 per person, and accounted for 17.9% of Gross Domestic Product (GDP).
- Medicare spending grew 6.2% to $554.3 billion in 2011, to 21% of total health care spending.
- Medicaid spending grew 2.5% to $407.7 billion in 2011, or 15% of total health care spending.
- Private health insurance spending grew 3.8% to $896.3 billion in 2011, or 33 percent of total health care expenditures.
- Out of pocket spending grew 2.8% to $307.7 billion in 2011, or 11 percent of total health care spending.
- Hospital expenditures grew 4.3% to $850.6 billion in 2011.
- Physician and clinical services expenditures grew 4.3% to $541.4 billion in 2011.
- Prescription drug spending increased 2.9% to $263.0 billion in 2011.
- Per person personal health care spending for the 65 and older population was $14,797 in 2004, 5.6 times higher than spending per child ($2,650) and 3.3 times spending per working-age person ($4,511).
Individuals (28%) and the federal government (28%) accounted for the largest share of those paying for health care in the USA. Businesses pay 21% of the costs of health care while state and local governments pay 17%.
The United States Centers for Medicare & Medicaid Services (CMS) project that health care spending will rise to 19.6% of GDP by 2021. Since the long term failure of the USA health care system has resulted in costs increasing faster than inflation every year for decades, it seems reasonable to expect that trend to continue. The burden on the USA grows more and more harmful to the USA each year these rising costs continue.
In 2004, the elderly (65 years old and older) accounted for 12% of the population, and accounted for 34% of spending.
Data from US CMS (sadly the way they provide the data online my guess is this url will fail to work in a year, as they post the updated data – I don’t see a way to provide a link to a url with persistent data).
Half of the population spends little or nothing on health care, while 5% of the population spends almost half of the total amount (The High Concentration of U.S. Health Care Expenditures: Research in Action).
Related: USA Spends Record $2.5 Trillion, $8,086 per person 17.6% of GDP on Health Care in 2009 – USA Spent $2.2 Trillion, 16.2% of GDP, on Health Care in 2007 – USA Health Care Costs reach 15.3% of GDP – the highest percentage ever (2005) – Systemic Health Care Failure: Small Business Coverage
A recent report by Deloitte, The Hidden Costs of U.S. Health Care: Consumer Discretionary Health Care Spending provides some interesting data.
Between 2006 and 2010 USA health care expenditures increased by 19%. Government spending accounted for 40% of costs (remember that figure is lowered due to Deloitte’s including inputed value for care of relatives). Those 65 and older account for 61% of the inputed cost care that is provided.
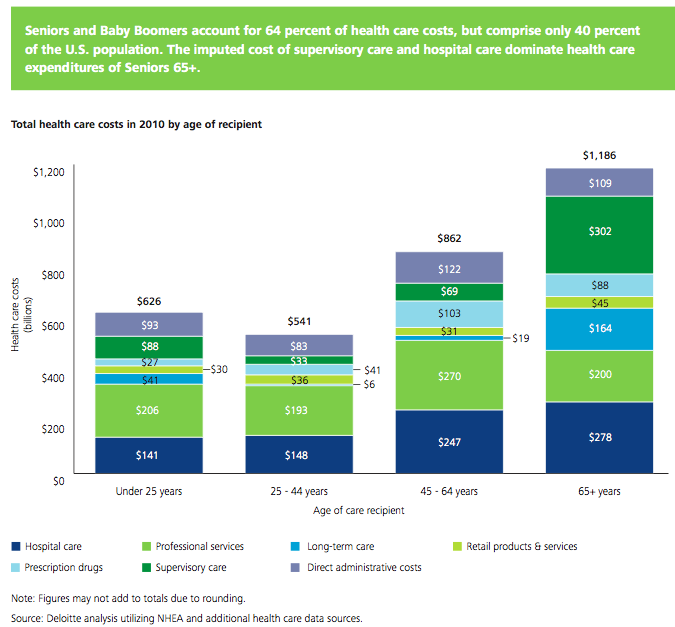
Seniors and baby boomers account for 64% of health care costs, but comprise only 40% of the USA population. The imputed cost of supervisory care and hospital care are far higher proportions of health care expenditures of seniors (65 and older).
I find this imputed value largely not worth considering. There are problems with the way we count GDP and economic activity (that affect health care and lots of other things). It is fine to be aware that they think $492 billion of extra care is given by family members but using that figure in any sensible way (other than saying hey there is a huge cost in people’s time to dealing with our health care system and sick people that isn’t counted in economic data) is questionable.
It is useful in looking at the increasingly old population we will see in the future and judging their is a large need for supervisory care that is not captured in just looking at the costs included in economic data currently. Not only will our grandkids have to pay for our living beyond our means today they will have to do so while providing unpaid care to their parents and grandparents.
The burden of long term supervisor care (that which can be provided by a non-health care professional) is one reason a resurgence in multi-generation housing options make sense to me. There are other good reasons also (child care, socialization, financial support to the young…). There are some real advantages and real disadvantages to such options. But I think economic advantages are going to encourage more of this going forward.
Related: Personal Finance Basics: Long-term Care Insurance – Health Care in the USA Cost 17.9% of GDP, $2.6 Trillion, $8,402 per person in 2010 – Resources for Improving Health Care System Performance
I do think there is merit to reducing yearly hours worked in the USA. The problem is this is all within a larger system. The USA’s broken health care system makes it extremely expensive to hire workers. One way to deal with the health care system failure is maximizing hours worked to spread out the massively expensive USA health care costs.
Also the USA standard of living is partially based on long hours (it is but one factor). We also have to work quite a few hours (about 5% of the total hours) to just bring us equal with other rich countries, in order to pay for our broken health care system.
Still reducing our purchases by cutting out some fancy coffee, a few pairs or shoes, a few cable channels (or all of them), text messages from overcharging phone companies… in order to have a couple more weeks of vacation would be a great tradeoff in my opinion. And one I have made with my career.
I have changed to part time in 2 of my full time jobs (to make my own sensible yearly hour model even if the bigger system can’t. Another time I bargained for more vacation time over more $. It isn’t easy to do though, most organizations are not willing to think and accommodate employees (hard to believe they respect people in this case, right?). The system is not setup to allow people to adjust total hours to maximize their well being.
Another option in the USA is to live within your means and then make your own sabbaticals during your career. Take a year off and travel the world, or hike the Appalachian Trail, or read trashy novels, or whatever you want.
Related: Medieval Peasants had More Vacation Time Than We Do – Dream More, Work Less – Vacation: Systems Thinking
The latest data from the commonwealth fund report confirms the status quo. The USA spends twice as much on their health care system for no better results. It is easier to argue the USA is below average in performance that leading. And for double the cost that is inexcusable.
Globally the rich countries citizens are not tremendously happy with health care systems overall. It seems likely not only does the USA cost twice and much as it should and perform poorly compared to countries doing an excellent job but the USA performs that poorly compared to countries that themselves have quite a bit of improvement to make. Which makes the state of the USA system even worse.
Data from the Commonwealth fund report published in 2011 with data for 2009, International Profiles of Health Care Systems, 2011:
Table showing, percent of GDP spent and total spending per capita in USD on health care by country.
| Country | 2007 | Spending |
|
2009 | Spending |
| Australia | 9.5% | $3,128 | 8.7% | $3,445 | |
| Canada | 9.8% | $3,326 | 11.4% | $4,363 | |
| Germany | 10.7% | $3,287 | 11.6% | $4,218 | |
| Japan | 8.5% | $2,878 | |||
| New Zealand | 9.0% | $2,343 | 10.3% | $2,983 | |
| UK | 8.3% | $2,724 | 9.8% | $3,487 | |
| USA | 16.0% | $6,697 | 17.4% | $7,960 |
| Survey of population, showing % that chose each statement (no data available for Japan) | |||||||
| Australia | Canada | Germany | New Zealand | UK | USA | ||
| 2007 – 2010 | 2007 – 2010 | 2007 – 2010 | 2007 – 2010 | 2007 – 2010 | 2007 – 2010 | ||
| Overall health system views | |||||||
| Only minor changes needed, system works well | 24 – 24 | 26 – 38 | 20 – 38 | 26 – 37 | 26 – 62 | 16 – 29 | |
| Fundamental changes needed | 55 – 55 | 60 – 51 | 51 – 48 | 56 – 51 | 57 – 34 | 48 – 41 | |
| Rebuild completely | 18 – 20 | 12 – 10 | 28 – 14 | 17 – 11 | 15 – 3 | 34 – 27 | |
| Percent uninsured | 0 – 0 | 0 – 0 | <1 – 0 | 0 – 0 | 0 – 0 | 16 – 16 | |
Under currently law in the USA by 2020 the uninsured rate should decline to under 5% by 2020 (still far more than any rich country – nearly all of which are at 0%).
On many performance measures in the report the USA is the worst performing system (in addition to costing twice as much). Such as Avoidable Deaths, 2006–07, the USA had 96 per 100,000, the next highest was the UK at 83, Australia was the lowest at 57. And Diabetes Lower Extremity Amputation Rates per 100,000 population, the USA had 36 the next highest was New Zealand at 12, the lowest was the UK at 9. For experiencing a medical, medication or lab test rrror in past 2 years, the USA was at 18%, next worst was Canada at 17%, best was UK at 8%. The USA was top performer in breast cancer five-year survival rate, 2002–2007. And sometimes the USA was in the middle, able to get same/next day appointment when sick: the USA was at 57%, New Zealand achieved 78% while Canada only reached 45%.
It is possible to argue the USA provides mediocre results, which is consistent with most global health care performance measures. Unless you directly benefit from the current USA system it is hard to see how you can argue it is not the worst system of any rich country. Costing twice as much and achieving middling performance. All that doesn’t even factor in the cost in anguish and bankruptcies and restricting individual freedom (when you have to stay tied to a job you would rather leave, just because of health insurance) caused by the difficulty getting coverage and fighting with the insurance companies for payment and coverage for treatment expenses.
Related: Measuring the Health of Nations – USA Paying More for Health Care – Traveling for Health Care – resources for improvement health system performance
Total health expenditures in the USA in 2010 reached $2.6 trillion, $8,402 per person or 17.9% percent of GDP. All these are all time highs. Every year, for decades, health care costs have taken a larger and larger portion of the economic value created in the USA. The costs have risen much more rapidly than the costs in the rest of world. This creates a burden that slows the USA economy – it acts as a friction dragging everything else down. We not only need to slow down how fast we are getting worse (which we have done the last 2 years) but actually start making up for all the ground lost in the last few decades. We haven’t even started on that. The amount of work to do in getting our health system back to mediocre and reasonably priced is enormous (currently we have mediocre performance and extremely highly priced – twice as costly as other rich countries).
In 2009 the USA Spent Record $2.5 Trillion, $8,086 per person 17.6% of GDP on Medical Care.
USA health care spending grew 3.9% in 2010 following an increase of 3.8% in 2009. While those are the two slowest rates of growth in the 51 year history of the National Health Expenditure Accounts, they still outpaced both inflation and GDP growth. So yet again the health system expenses are taking a bigger portion of overall spending.
As a result of failing to address this issue for decades the problem is huge and will likely take decades to bring back just to a level where the burden on those in the USA, due to their broken health care system, is equal to the burden of other rich countries. Over 2 decades ago the failure in the health care system reached epidemic proportions but little has been done to deal with the systemic failures. Dr. Deming pointed to excessive health care cost, back then, as one of 7 deadly diseases facing American business. The fact that every year costs have increased more than GDP growth and outcome measures are no better than other rich countries shows the performance has been very poor. The disease is doing even more harm today.
Related: USA Heath Care System Needs Reform – USA Spends Record $2.3 trillion ($7,681 Per Person) on Health Care in 2008 – Systemic Health Care Failure: Small Business Coverage – Measuring the Health of Nations – How to improve the health care system performance – Management Improvement in Healthcare – USA Spent $2.2 Trillion, 16.2% of GDP, on Health Care in 2007
I believe long term disability insurance is a must for a safe personal financial plan. The risk of not being covered isn’t worth it. An office worker should have a very low risk of something happening that qualifies you for receiving benefits (even with fairly serious injuries for a hunter-gatherer or farmer they can earn a living).
That is actually the perfect situation for insurance. Insurance should be cheap when the risk is small. You want insurance for unlikely but very costly events. You don’t want insurance for likely and inexpensive events (paying the middle man just adds to the cost).
I believe, other than health insurance it is the most important insurance. For someone with dependents life insurance can be important too. And auto and homeowners insurance are also important. Insurance if an important part of a smart personal finance. It is wise to chose high deductibles (to reduce cost).
In many things I believe you can chose what you want to do and just deal with the results. Forgoing health or disability insurance I think don’t fall into that category. Just always have those coverages. I think doing without is just a bad idea.
When I would have had gaps in coverage from work, I have purchased disability insurance myself.
I am all in favor of saving money. About the only 2 things I don’t believe in saving money being very important are health and disability insurance. Get high deductible insurance in general (you should insure against small loses). And with disability insurance you can reduce the cost by having the insurance only start after 6 or 12 months (I chose 12). As you get close to retirement (say 5 years) the risk is much less, you only have so many earning years left. If you wanted to save some money at that point it might be ok if you have saved well for retirement and have a cushion (in case you have to retire 3 year early). Long term care insurance may well be wise to get (if you didn’t when it was cheaper and you were younger. Long term care insurance is really tricky and very tied to whatever our politicians decide not to do (or do) about the broken health care system we have in the USA. The cost also becomes higher as it is moving toward a likely event, instead of a unlikely event (as you age you are more frail).
Related: How to Protect Your Financial Health – Personal Finance Basics: Avoid Debt
We have had over 20 years of health care costs going up more than inflation – every year. That is an amazing (and horrifyingly bad) record. We need very strong evidence to conclude we can even just reduce the increase in damage done year after year by the broken health care system.
Getting to the point where we actually start reducing the increased damage done each year is a big leap from where we are (reducing the acceleration of damage [reducing from hugely above inflation to largely above inflation is better than not doing that but hardly a good sign – it is still worse than the year before, just the increase in badness is less than the increase in badness from the previous year).
Health care is so bad I often see people try to look at data and see that the rate of getting worse is declining and seeing that as a positive sign. Things are still getting worse. And they are already extremely bad. I really can’t see arguing for things getting worse more slowly as being something we should be happy with. Even just making tiny improvements (given how bad we have let things get over the decades is not good enough). We need to actually reduce spending on health care. Certainly, the absolutely least we can expect is increasing less than inflation (that is an extremely low expectation – though one the health care system has failed at for decades). We shouldn’t accept such horrible performance.
Once we actually can start making things better year after year (not just reducing the acceleration of badness) we likely have decades before we can reduce the enormous drain the USA health care system puts on all of us living here to a level that is just average for rich countries.
There are pockets of good things being done in health care but so so so much more is needed.
Some other positive results in 2010:
• Emergency room visits were 71 per 1000 lives, or 38% of average. Serigraph people use the ER room only in a real emergency.
• Inpatient surgeries were 51 vs. 80 average per 1000.
• Radiology scans totaled 775 vs. 1300.
• Claims related to poor lifestyle choices were only 3% of our total claims, versus 7.7% for our peers.
These strikingly positive numbers are a testimonial to the engagement of the Serigraph workforce in reforming how care is delivered in this country. They are helping to mange this complex issue.
Reforms such as a consumer-driven plan, on-site primary care, finding the best centers of value and transparency on prices and quality are making a difference, a huge difference.
We still have a lot of innovation to do. For instance, we decided recently to go after depression, the second most costly chronic disease in the work place. Few companies, if any, have an enlightened managerial effort on that front.
Great work by Serigraph.
Related: The USA Can’t Afford to Pay for the Current Health Care System – Resources to improve health care system performance – articles on improving health care
The very frustrating aspect of the broken health care system in the USA is that it has been an enormous problem for decades. It isn’t that we have just discovered we have a fatally poor health care system in the last few years. The broken system has been obvious for decades and keeps getting worse. Thankfully in the last few years more and more of those with clout in the current economic system are standing up to demand improvement.
Costs need to be removed from the system. Hundreds of billions a years should easily be removable by reducing paperwork and reducing waste in the system. As you say some reduction will also have to come in limiting spending that is being done now for worthwhile and worthless procedures. That should also easily save hundreds of billions a year. However in the decades of allowing this broken system to get worse and worse, it is not at all certain that merely taking $500 billion a year out of the costs will be enough.
It might well require eliminating even more medical work and reducing the income of those that are taking from the system now. My guess is the most logical places for reducing income come from massively overpriced drugs, overpaid specialists, overpaid executives in insurance companies. I suppose some might think nurses should be paid less, that isn’t my belief, but we will see what happens.
As sensible management of the system is adopted, over time, increasing the saving from eliminating waste should grow. Unfortunately we have wasted decades and so counting on us acting responsibly and adopting a focus on eliminating waste can’t be expected until we show a good 10-15 years of systemic effort on that front.
In response to: Paying for health care
Related: USA Spends Record $2.5 Trillion, $8,086 per person 17.6% of GDP on Health Care in 2009 – articles on improving the health care system in the USA – Broken Health Care System: Self-Employed Insurance – Health Insurers Propose Pricing and Coverage Without Respect to Health
U.S. health care spending increased yet again in 2009, increasing 4%. Total health expenditures reached $2.5 trillion, which translates to $8,086 per person or 17.6% of the nation’s Gross Domestic Product (GDP). This represents yet another record high percentage of GDP taken by health care – for decades, year after year, health care takes more and more of the economic resources of the country. The broken USA health care system costs twice as much as other rich countries for worse results. And those are just the direct accounting costs – not the costs of millions without preventative health care, sleepness nights worrying about caring for sick children without health coverage, millions of hours spent on completing forms to try and comply with the requirements of the health care system’s endless demand for paperwork, lives crippled by health care bankruptcies…
Medicare spending grew 7.9% in 2009 to $502.3 billion. The senior citizen and health care lobbies have continued to increase spending on medicare. Too bad they can’t work on improvement instead of increased spending. Spending for fee-for-service (FFS) Medicare accelerated in 2009, increasing 5.5%. Medicare Advantage (MA) spending increased 15.8% in 2009 following 21.4% growth in 2008 and was primarily attributable to a continuation of significant increases in MA enrollment. Total Part D spending (which includes spending for benefits, government administration, and the net cost of health insurance) increased 9.3% to $54.5 billion in 2009.
Medicaid (which is a line item for the cost of medical treatment for the un-insured, though far from the only cost): Total Medicaid spending grew 9.0% in 2009 to $373.9 billion was driven by a 7.4% increase in Medicaid enrollment. Federal Medicaid expenditures increased 22%, while state Medicaid expenditures declined 9.8%. This difference in growth is due to a significant increase in the Federal Medical Assistance Percentages (FMAP) used to determine federal Medicaid payments to states—a provision of the American Recovery and Reinvestment Act of 2009 (ARRA). Essentially the federal government funded the spending since the states were almost all out of money.
Private Health Insurance: Private health insurance premiums grew 1.3% in 2009 (actually a pretty great figure by itself – unfortunately one lone good piece of data is not enough). Benefit payment growth increased 2.8% in 2009. These trends were heavily influenced by the recession, which resulted in private health insurance enrollment declines (which reminds you why looking at 1 piece of data isn’t a good idea). In 2009, spending for benefits increased faster than premiums, and as a result, the net cost of private health insurance (or the difference between premiums and benefits) fell to an 11.1% share of total private health insurance spending.
The burden of the large costs of the health care system in the USA are financed by businesses (21%), households (28%), governments (44%), and other private sponsors [foundations, charities and the like] (7%).
Read the complete National Health Expenditure Data report.
Related: USA Spends Record $2.3 trillion ($7,681 Per Person) on Health Care in 2008 – USA Heath Care System Needs Reform – Resources to Help Improve the Health Care System – CEOs Want Health-Care Reform
5 painful health-care lessons from Massachusetts:
Hence reform’s proponents boast that expenses have risen only $354 million or around 6% a year. But the real increase is double that, including the federal share. And it’s highly possible that given the current budget pressures, the U.S. will reduce the contribution that has encouraged the state to spend so lavishly…
Interesting article. I don’t agree with all their claims. It isn’t as though expecting to go from the extremely broken system we have suffered with for decades to one without flaw is a likely outcome. What would be nice is if we can learn from experiments and adjust. Those who profit enormously at the expense of society from the current system are going to provide critiques of any changes. And those that want to fix the broken system should listen to sensible criticism and make improvements (not just defend any changes because the existing system is so bad).
Related: USA Heath Care System Needs Reform – International Health Care System Performance – USA Spends Record $2.3 trillion ($7,681 Per Person) on Health Care in 2008