Amazon announced they are opening major new offices in Arlington, Virginia and New York City. Each site will hold 25,000 new Amazon employees at an average salary above $150,000. Getting to that level with take many years, next year under 1,000 employees will be at each site.
I lived in Arlington for many years and own rental property there. The Amazon decision is likely to catalyze a much more rapid ascent of the technology sector in the DC area. The DC area has a strong foundation of internet technology to build upon, though many people are not aware of this. The Amazon move will likely help shift the perception of the DC area as government driven and the growth of internet technology activity in the area is likely to grow rapidly.
The 25,000 jobs (even with a greater than average salary of $150,000) isn’t the main impact of the announcement. The big news is the likelihood of Amazon’s highly visible efforts catalyzing more tech businesses (especially 5-7 years down the road when some of the Amazon people start creating their own startups). It isn’t that Amazon is moving into a barren tech landscape, there is already a strong base from which to launch a long term tech boost to the DC area economy.
The direct impact of Amazon’s employees renting and buying in and around Arlington is not going to be very strong for a couple years. Amazon plans to add 500 people to Arlington in 2019; 1,000 more in 2020 and 2,000 more in 2021. But investors already can plan for a strong future demand from Amazon and all the activity that Amazon’s growing presence will contribute to.
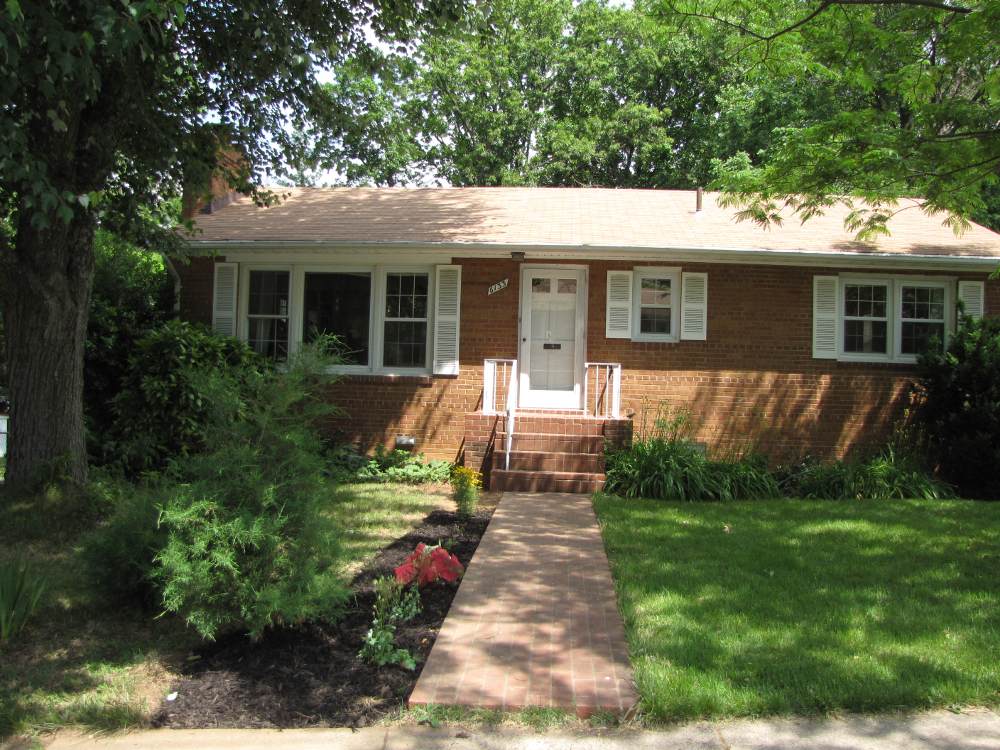
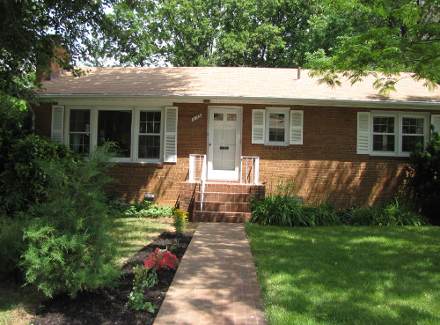
I am actually selling my house in Arlington (in this photo), with a very nice yard (explanation below).
The increase in housing prices in 2019 and 2020 will be primarily investor driven. In 2020, 2021 and going forward the impact of Amazon employees directly and all the extra activity spurred on will start to have an impact. Unlike the stock market where such a predicable strong investment future would drive prices up say 30-50% immediately, in real estate it is much more likely for the gains to be spread out over the long term.
If prices in housing increase in Arlington it is more likely they would increase say 10% in the first year and then an extra 3% (above what the increase would have been without Amazon’s move) each of the next 10 years. From a long term investors perspective this provides a great possibility for buying now (even after the news) and not having to pay a huge premium.
Rental housing prices are not likely to go up much immediately. And they will take longer to show up in the market, they will be much more closely tied to new job additions (from Amazon and others). So investors have to pay a higher price today (say 5-10% higher) and in the first 1 or 2 years probably see no higher rents than they would have otherwise. And even after 2021 those rents are likely to go up more slowly than prices of real estate.
The number of USA households spending more than 50% of their income on rent is expected to rise at least 11% to 13.1 million by 2025, according to new research by Harvard University’s Joint Center for Housing Studies and Enterprise Community Partners.
The findings suggest that even if trends in incomes and rents turn more favorable, a variety of demographic forces—including the rapid growth of minority and senior populations—will exert continued upward pressure on the number of severely cost-burdened renters.
Under the report’s base case scenario for 2015-2025, the number of severely burdened households aged 65-74 and those aged 75 and older rise by 42% (830,000 to 1.2 million) and 39% (890,000 to 1.2 million); the number of Hispanic households with severe renter burdens increases 27% (2.6 million to 3.4 million); and the number of severely burdened single-person households jumps by 12% (5.1 million to 5.7 million).

Graph from the report. The blip of an improvement from 2010 to 2013 is due to the decline in home ownership which changed the makeup of the “rental population.” Moderate (severe)
burdens are defined as housing costs of 30–50% (more than 50%) of household income. Households with zero or negative income are assumed 30 to be severely burdened, while renters not paying cash rent are assumed to be unburdened.
Enterprise Community Partners argues for more government action on affordable housing. I am worried about such efforts being done in a sensible way but I do agree with the concept of supporting affordable housing. I would use zoning to require affordable housing construction along with market rate housing.
Doing such things well requires a government that is not corrupt and fairly competent which isn’t so easy looking across the USA (unfortunately). An example of somewhere that does this fairly well is Arlington Country, Virginia (which also has a good non-profit focused on affordable housing). Good non-profits can play a vital part in affordable housing over the long term.
When you sell your primary residence in the USA you are able to exclude $250,000 in capital gains (or $500,000 if you file jointly). The primary test of whether it is your primary residence is if you lived there 2 of the last 5 years (see more details from the IRS). You can’t repeat this exemption for 2 years (I believe).
It doesn’t matter if you buy another house or not, that exclusion of up to $250,000 is all that can be excluded (you must pay tax on anything above that amount – taxed at capital gains rates for long term gains).
For investment property you can do 1031 exchanges which defers capital gains taxes. Otherwise capital gains will be taxed as you would expect (as capital gains).
When you inherit a house the tax basis will be “stepped up” to the current market rate. So if you then sell your basis isn’t what the owner paid for it, but what it was worth when it was given to you.
Related: Looking for Yields in Stocks and Real Estate – Your Home as an Investment – Home Values and Rental Rates
Based on my thoughts on killing the Goose laying golden eggs in Iskandar Malaysia posted on a discussion forum. The government has instituted several several policies to counteract a bubble in luxury real estate prices in the region (new taxes on short term capital gains in real estate [declining amounts through year 6]), increasing limits on purchases by foreigners, new transaction fees (2% of purchase price?) for real estate transactions, requirements for larger down-payments from purchasers…
Iskandar is 5 times the size of Singapore and is in the state of Johor in Malaysia. Johor Bahru is the city which makes up much of Iskandar but as borders are currently drawn Iskandar extends beyond the borders of Johor Bahru.
The prospects for economic growth in Iskandar Malaysia in the next 5, 10 and 15 years remain very strong. They are stronger than they were 5 years ago: investments that produce economic activity (theme parks, factories, hospitals, hotels, retail, film studio…) have come online and more on being built right now.
Cooperation with Singapore is the main advantage Iskandar has (Iskandar is next to the island of Singapore similar to those areas surrounding Manhattan). It provides Iskandar world class advantages that few other locations have (it is the same advantages offered by lower cost areas extremely close to world class cities – NYC, Hong Kong, London, San Francisco etc.). Transportation connections to Singapore are critical and have not been managed as well as they should have been (only 2 bridges exist now and massive delays are common). A 3rd link should be in place today (they haven’t even approved the location yet).
A MRT connection to Singapore (Singapore’s subway system) should be a top priority of anyone with power interested in the future economic well being of Iskandar and Johor. Johor Bahru doesn’t have a light rail system yet this would be the start of it. It has been “announced” as planned for 2018 but not officially designated or funded yet.
I was just taking a look at a couple of properties in Zillow and found it interesting how big the real estate tax bite can be. I have 2 rental properties and the real estate tax cost is 15% and 12% of the rental income. At least for my area Zillow underestimate rent rates (the vacancy rate is very low and properties in general rent within days or weeks – at rates 10%+ higher than Zillow estimates on average -based on my very limited sample of just what I happen to notice).
I thought I would look at the real estate tax to property value estimate and rent estimate by Zillow in Various locations.
Arlington, Virginia – real estate taxes were 1% of estimated property value and 17.5% of rental estimate.
Chapel Hill, North Carolina – 1.5% of value and 41% of rental estimate.
Madison, Wisconsin – 2.4% of value and 39% of rental estimate.
Flagstaff, Arizona – .7% of value and 9.5% of rental estimate.
Grand Junction, Colorado – .4% of value and 6% of rental estimate.
This is just an anecdotal look, I didn’t try to get a basket of homes in each market I just looked at about 1-5 homes so there is plenty of room for misleading information. But this is just a quick look and was interesting to me so I thought I would share it. While the taxes are deductible (from the profit of the rental property) they are a fixed expense, whether the house is rented or not that expense must be paid.
A high tax rate to rental rate is a cash flow risk – you have to make that payment no matter what.
In my opinion one of the most important aspects of rental property is keeping the units rented. The vacancy rate for similar properties is an extremely important piece of data. Arlington, Virginia has an extremely low vacancy rate. I am not sure about the other locations.
I wanted to use Park Slope, Brooklyn, NYC but the data was confusing/limited… so I skipped it; the taxes seemed super low.
Related: USA Housing Rents Increased 5.4% in the Last Year (Sep 2012) – USA Apartment Market in 2011 – Top Markets in the USA for Buying Rental Property (2011) –
Home Values and Rental Rates
A recent report by Deloitte, The Hidden Costs of U.S. Health Care: Consumer Discretionary Health Care Spending provides some interesting data.
Between 2006 and 2010 USA health care expenditures increased by 19%. Government spending accounted for 40% of costs (remember that figure is lowered due to Deloitte’s including inputed value for care of relatives). Those 65 and older account for 61% of the inputed cost care that is provided.
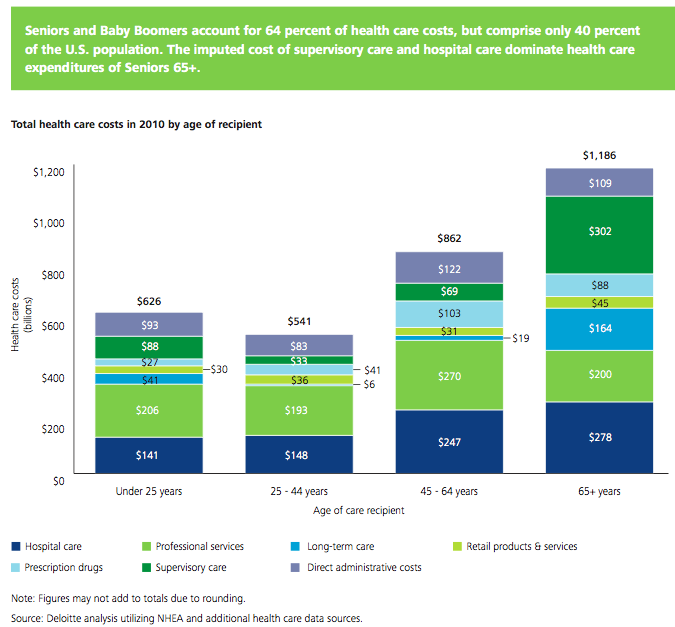
Seniors and baby boomers account for 64% of health care costs, but comprise only 40% of the USA population. The imputed cost of supervisory care and hospital care are far higher proportions of health care expenditures of seniors (65 and older).
I find this imputed value largely not worth considering. There are problems with the way we count GDP and economic activity (that affect health care and lots of other things). It is fine to be aware that they think $492 billion of extra care is given by family members but using that figure in any sensible way (other than saying hey there is a huge cost in people’s time to dealing with our health care system and sick people that isn’t counted in economic data) is questionable.
It is useful in looking at the increasingly old population we will see in the future and judging their is a large need for supervisory care that is not captured in just looking at the costs included in economic data currently. Not only will our grandkids have to pay for our living beyond our means today they will have to do so while providing unpaid care to their parents and grandparents.
The burden of long term supervisor care (that which can be provided by a non-health care professional) is one reason a resurgence in multi-generation housing options make sense to me. There are other good reasons also (child care, socialization, financial support to the young…). There are some real advantages and real disadvantages to such options. But I think economic advantages are going to encourage more of this going forward.
Related: Personal Finance Basics: Long-term Care Insurance – Health Care in the USA Cost 17.9% of GDP, $2.6 Trillion, $8,402 per person in 2010 – Resources for Improving Health Care System Performance
The USA economy is still in very fragile ground. The continued problems created by policies focused on aiding too big too fail institutions and continued huge federal budge deficits are dangerous. And the continued problems in Europe and mounting problems in China are not helping. Still, rental prices continue to rise across the USA.
The graph above shows housing rents (as shown by the Zillow rent index) have increased 5.4% in the last year (through July) across the USA. In Boston the increase was 4.5%; Grand Junction, Colorado -4.9%; San Francisco up 8.8%; Washington DC up 7.3%; Raleigh, NC up 1.8% (though the last one couldn’t be added to the graph for some reason). I just picked some cities I found interesting – with some diversity.
Housing prices are up 1.2% in the same period, according to the Zillow price index.
When looking at data on rental prices and home prices you will notice different sources give different readings. Judging these changes across the nation is very difficult and requires making judgements. Even at the local level the measures are imprecise so the figures you see will vary. Taking a look at several different measures, from reputable sources, is often wise.
Related: USA Apartment Market in 2011 – Top USA Markets for Buying Rental Property – Apartment Vacancies Fall to Lowest in 3 Years in the USA (April 2011) – Apartment Rents Rise, Slightly, for First Time in 5 Quarters (April 2010)
The national occupancy climbed 110 basis points during the year, and effective rents jumped 4.7% according MPF Research.
Occupancy rates increased to 94.6% at the end of 2011, up from 93.5% a year ago and from 91.8% when the occupancy rates bottomed in late 2009.
MPF Research predicts occupancy rates to increase another 50 basis points, and rents to rise 4.5%.
Northern California’s apartment markets ranked as the nation’s rent growth leaders during calendar 2011, despite the fact that some weakness registered in the performances recorded in parts of the Pacific Northwest specifically during the fourth quarter. Year-over-year, effective rents for new leases jumped 14.6% in San Francisco, 12.3% in San Jose, and 9% in Oakland. With rents down 0.4%, Las Vegas was the nation’s only major apartment market that lost pricing power during calendar 2011.
Rent Growth Leaders in Calendar 2011
| Rank | Metro Area | Annual Rent Growth |
| 1 | San Francisco | 14.6% |
| 2 | San Jose | 12.3% |
| 3 | Oakland | 9.0% |
| 4 | Boston | 8.3% |
| 5 | New York | 7.3% |
| 6 | Austin | 7.2% |
Related: Apartment Vacancies Fall to Lowest in 3 Years in the USA (April 2011) – Top USA Markets for Buying Rental Property – Apartment Rents Rise, Slightly, for First Time in 5 Quarters – It’s Now a Renter’s Market

Chart showing loan delinquency rates from 2000-2011, shows seasonally adjusted data for all banks for consumer and real estate loans. The chart is available for use with attribution. Data from the Federal Reserve.
Residential real estate delinquency rates increased in the first half of 2011 in the USA. Other debt delinquency rates decreased. Credit card delinquency rates have actually reached a 17 year low.
While the job market remains poor and the serious long term problems created by governments spending beyond their means (for decades) and allowing too big to fail institutions to destroy economic wealth and create great risk for world economic stability the USA economy does exhibit positive signs. The economy continues to grow – slowly but still growing. And the reduction in delinquency rates is a good sign. Though the residential and business real estate rates are far far too high.
Related: Consumer and Real Estate Loan Delinquency Rates 2000-2010 – Real Estate and Consumer Loan Delinquency Rates 1998-2009 – Government Debt as Percent of GDP 1998-2010 for OECD
For the first time ever average 30 year fixed mortgage rates have fallen under 4%. My guess about interests rates have not been very good the last decade or so. I can’t believe people actually want to lend at these rates but obviously I have been wrong. The risks of lending at these rates over the long term just seem way too high to take a paltry 4%. But obviously I have been wrong.
So if you didn’t refinance when I suggested it (and refinance, myself), previously, you may want to look at doing so now. Or you may believe that listen to me about interest rates doesn’t seem very wise.
I have even read that banks are reducing fees in order to encourage refinancing. Seems crazy to me, but what do I know.
You do need to have a decent loan to value ratio (certainly no more than 90%, and probably 80% would be better). That can be difficult for those that have had large decreases in their homes value. Also you need a great credit rating and a stable job situation. But if you qualify refinancing at these rates should be a great financial move for many. I’m perfectly happen to have done so earlier, I didn’t quite pick the bottom but I still think over 30 years these rates (the current rates and earlier rates of 4 1/4% or 4 3/8%) will seem like a dream.
Related: Fixed Mortgage Rates Reach New Low (August 2010) – Lowest 30 Year Fixed Mortgage Rates in 37 Years (Dec 2008) – The Impact of Credit Scores and Jumbo Size on Mortgage Rates (Jan 2009)