The total stock market capitalization by country gives some insight but it is also data that is a bit muddy. The data doesn’t tell you how the economies of the countries are doing as there is quite a bit of room for misinterpreting the data.
Apple, Alphabet, Intel, 3M, Abbvie… all are included in the USA market capitalization but much of their sales, earnings and employment are overseas. And USA companies have done very well in global markets so the USA totals are not just an indication how the USA has performed but includes great gains made by profiting from global growth. Also you may be surprised to learn that 26% of USA equities are owned by investors outside the USA.
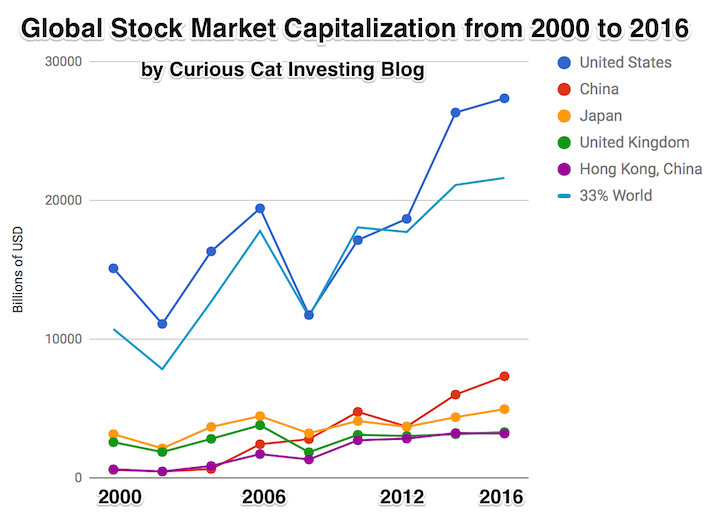
The chart shows the top countries based on stock market capitalization, with data from 2000 to 2016. The chart was created by Curious Cat Investing and Economics Blog may be used with attribution. Data from the World Bank.
It is important to keep in mind the data is shown in current USA dollars, so large swings in exchange rates can have a large impact.
China’s performance has been remarkable. China also shows some of the challenges in collecting this data. I am fairly certain Alibaba (BABA), one of the 10 most valuable companies in the world and a Chinese company has the stock issued in the USA (even this is confusing as it is a complex arrangement but the only publicly traded stock is traded in the USA). And many other Chinese companies are traded this way and therefore are not included in the Chinese total value. In addition Hong Kong is part of China but also separate. The data is reported separately by the world bank and I include them that way in the charts.
As with so much recent economic data China’s performance here is remarkable. China grew from 1.8% of world capitalization in 2000 to 6.9% in 2012 and 11.2% in 2016. Adding Hong Kong to China’s totals shows 3.7% in 2000 with growth to to 12.2% in 2012 and 16.2% in 2016. If you look at my post global stock market capitalization from 2000 to 2012 you will see significantly different historical data for Hong Kong. Collecting this data is much more complex than people realize and data determinations can change over the years resulting in changes in historical data.
The chart shows the 1/3 of the total global market capitalization in order to have the chart display look better (and it also makes it easier to compare the USA performance to the total global performance). The USA market capitalization was at 46.9% of the global market cap in 2000 and fell to 31.6% in 2000 before rising to 42% in 2016. This shows that the USA has largely held its own globally as measured by market cap. This may not seem impressive but when you consider that China has grown from 3.7% to 16.2% you can see that for the market cap outside of China the USA has actually gained quite a bit of ground. This is the result of what I mentioned before – how well USA companies have done at capture global markets (especially in high technology areas with very high profits and therefore very high market caps).
The Great Convergence by Richard Baldwin makes some interesting points about “globalization.” I actually find the long term history the most interesting aspect. It is very easy for people today to forget the recently rich “West” has not always been so dominant.
That shows how quickly things changed. The industrialization of Europe and the USA was an incredibly powerful global economic force. The rapid economic gains of Japan, Korea, Singapore, China and India in the last 50 years should be understood in the context of the last 200 years not just the last 100 years.
A central point Richard advocates for in the book is realizing that the current conditions are different from the conditions in which traditional economic theory (including comparative advantage) hold. The reasoning and argument for this claim are a bit too complex to make sensibly in this post but the book does that fairly well (not convincingly in my opinion, but enough to make the argument that we can’t assume traditional economic theory for international trade is completely valid given the current conditions).
I don’t expect this blog post to convince people. I don’t even think his book will. But he makes a case that is worth listen to. And I believe he is onto something. I have for years been seeing the strains of “comparative advantage” in our current world economy. That doesn’t mean I am not mainly a fan of freer trade. I am. I don’t think complex trade deals such as TPP are the right move. And I do think more care needs to be taken to consider current economic conditions and factor that into our trade policies.
Richard Baldwin uses 3 costs and the economic consequences of those changing over time to show globalizations history, where we are today and where we are going.
It isn’t very easy to follow but the book provides lots of explanation for the dramatic consequences of these costs changing over time.
One of his themes is that mobility of labor is still fairly costly. It isn’t easy to move people from one place to another. Though he does discuss how alternatives that are similar to this (for example telepresence and remote controlled robots to allow a highly technical person to operate remotely) without actually do moving the person are going to have huge economic consequences.
The “high spillovers” are the positive externalities that spin off of a highly knowledgable workforce.
Global wind power capacity has increased 391% from 2005 to 2012. The capacity has grown to over 3% of global electricity needs.
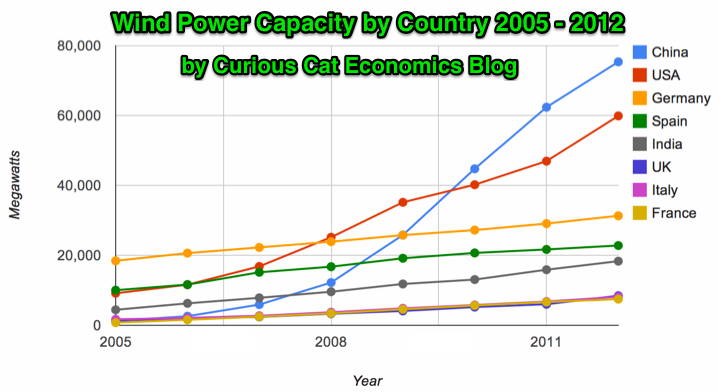
Chart by Curious Cat Economics Blog using data from the Wind Energy Association. Chart may be used with attribution as specified here.
The 8 countries shown on the chart account for 82% of total wind energy capacity globally. From 2005 to 2012 those 8 countries have accounted for between 79 and 82% of total capacity – which is amazingly consistent.
Japan and Brazil are 13th and 15th in wind energy capacity in 2012 (both with just over one third of France’s capacity). Japan has increased capacity only 97% from 2005 to 2012 and just 13% from 2010 to 2012. Globally wind energy capacity increased 41% from 2010 to 2012. The leading 8 countries increased by 43% collectively lead by China increasing by 68% and the USA up by 49%. Germany added only 15% from 2010 through 2012 and Spain just 10%.
Brazil has been adding capacity quickly – up 170% from 2010 through 2012, by far the largest increase for a county with significant wind energy capacity. Mexico, 24th in 2012, is another country I would expect to grow above the global rate in the next 10 years (I also expect Brazil, India and Japan to do so).
In 2005 China accounted for 2% of wind energy capacity globally they accounted for 30% in 2012. The USA went from 15% to 24%, Germany from 31% to 12%, Spain from 17% to 9% and India from 8% to 7%.
Related: Global Wind Energy Capacity Exceeds 2.5% of Global Electricity Needs (2011) – Nuclear Power Generation by Country from 1985-2010 – Chart of Wind Power Generation Capacity Globally 2005 to 2012 (through June)
Medical “tourism” is a potentially huge market. The size of the market is greatly aided by the extremely expensive and broken USA health care system. Even while the standard rich country provides the same, or better, results than the USA for half the cost they are not doing well either (so the USA is very bad compared to pretty bad results for rich countries on average).
Medical tourism is on of the most attractive economic growth areas. However the competition is fairly high as the attractiveness of building such an industry is well known. Countries that have very good potential are: Thailand, Mexico, Malaysia, Singapore (for high end solutions), Costa Rica, India, Philippines and Panama. India has some great advantages but they have a deeply ingrained and extremely unhelpful bureaucracy. It seems to me that that creates a burden that likely means India can’t complete with the others effectively.
Even for the simplest aspect – visas for those seeking to bring income into the country as medical tourists I don’t have confidence India can do well.
Cayman to Singapore Gain as Rules Stump Clinics: Corporate India
“They’ve done everything to ruin our prospects of becoming a tourism center,” Reddy said. “I once said India should become the global health-care destination–now I’m swallowing those words. It could grow 10-fold in the next five years, if only the government would facilitate it, the way others have.”
India continues to be held back economically (across the entire economy not just in health care) by ineffective and burdensome regulation and government inefficiency.
The USA actually has a portion of the medical tourism market – those that have no concern about price (royalty, trust fund babies, movie stars etc.). Those with any concern about price can find the same level of care in Singapore, Japan, France, etc. at a fraction of the price.
I believe 2 or 3 countries in South East Asia will do very well with international medical care. The extent to which Thailand, Philippines, Singapore and Malaysia (and potentially others) do in this field could greatly impact their economic success. There is a great potential for Singapore and Malaysia to cooperate in this area (in Malaysia’s Iskandar region, which borders Singapore).
Related: Traveling To Avoid USA Health Care Costs –
Traveling for Health Care (2007) – Leading Countries for Economic Freedom: Hong Kong, Singapore, New Zealand…
There have been quite a few complaints about companies hiring foreign nationals to work in the USA to save money (and costing citizens jobs or reducing their pay). The way the laws are now, companies are only suppose to hire people to work in the USA that can’t be met with USA workers. The whole process is filled with unclear borders however – it is a grey world, not black and white.
I think one of the things I would do is to make it cost more to hire foreigners. Just slap on a tax of something like $10,000 per year for a visa. If what I decided was actually going to adopted I would need to do a lot more study, but I think something like that would help (maybe weight it by median pay – multiple that by 2, or something, for software developers…).
It is a complex issue. In general I think reducing barriers to economic competition is good. But I do agree some make sense in the context we have. Given the way things are it may well make sense to take measures that maybe could be avoided with a completely overhauled economic and political system.
I believe there are many good things to having highly skilled workers in your country. So if the problem was in recruiting them (which isn’t a problem in the USA right now) then a tax on the each visa wouldn’t be wise, but I think it might make sense now for the USA.
I think overall the USA benefits tremendously from all the workers attracted from elsewhere. We are much better off leaving things as they are than overreacting the other way (and being too restrictive) – but I do believe it could be tweaked in ways that could help.
Outsourcing Made by India Seen Hit by Immigration Law
…
Indians received more than half the 106,445 first-time H-1Bs issued in the year ending September 2011, according to a U.S. Department of Homeland Security report. The second-biggest recipient was China with 9.5 percent.
…
While the legislation raises the annual H-1B cap to as much as 180,000 from 65,000, it increases visa costs five-fold for some companies to $10,000. It also bans larger employers with 15 percent or more of their U.S. workforce on such permits from sending H-1B staff to client’s sites.
The aim is to balance the U.S. economy’s need to fill genuine skills gaps with protection for U.S. citizens from businesses that may use the guest-worker program to bring in cheaper labor
Related: Relocating to Another Country – Working as a Software Developer – Science PhD Job Market in 2012 – Career Prospect for Engineers Continues to Look Positive
Hong Kong again topped the rankings, followed by Singapore, New Zealand, and Switzerland. Australia and Canada tied for fifth, of the 144 countries and territories in the Fraiser Institute’s 2012 Economic Freedom of the World Report.
“The United States, like many nations, embraced heavy-handed regulation and extensive over-spending in response to the global recession and debt crises. Consequently, its level of economic freedom has dropped,” said Fred McMahon, Fraser Institute vice-president of international policy research.
The annual Economic Freedom of the World report uses 42 distinct variables to create an index ranking countries around the world based on policies that encourage economic freedom. The cornerstones of economic freedom are personal choice, voluntary exchange, freedom to compete, and security of private property. Economic freedom is measured in five different areas: (1) size of government, (2) legal structure and security of property rights, (3) access to sound money, (4) freedom to trade internationally, and (5) regulation of credit, labor, and business.
Hong Kong offers the highest level of economic freedom worldwide, with a score of 8.90 out of 10, followed by Singapore (8.69), New Zealand (8.36), Switzerland (8.24), Australia and Canada (each 7.97), Bahrain (7.94), Mauritius (7.90), Finland (7.88), Chile (7.84).
The rankings and scores of other large economies include: United States (18th), Japan (20th), Germany (31st), South Korea (37th), France (47th), Italy (83rd), Mexico (91st), Russia (95th), Brazil (105th), China (107th), and India (111th).
When looking at the changes over the past decade, some African and formerly Communist nations have shown the largest increases in economic freedom worldwide: Rwanda (44th this year, compared to 106th in 2000), Ghana (53rd, up from 101st), Romania (42nd, up from 110th), Bulgaria (47th, up from 108th), and Albania (32nd, up from 77th). During that same period the USA has dropped from 2nd to 19th.
The rankings are similar to the World Bank Rankings of easiest countries in which to do business. But they are not identical, the USA is still hanging in the top 5 in that ranking. The BRICs (Brazil, Russia, India and China) do just as poorly in both. The ranking due show the real situation of economies that are far from working well in those countries. China and Brazil, especially, have made some great strides when you look at increasing GDP and growing the economy. But there are substantial structural changes needed. India is suffering greatly from serious failures to improve basic economic fundamentals (infrastructure, universal education, eliminating petty corruption [China has serious problems with this also]…).
Singapore is again ranked first for Ease of Doing Business by the World Bank.
| Country | 2011 | 2008 | 2005 | |
|---|---|---|---|---|
| Singapore | 1 | 1 | 2 | |
| Hong Kong | 2 | 4 | 6 | |
| New Zealand | 3 | 2 | 1 | |
| United States | 4 | 3 | 3 | |
| Denmark | 5 | 5 | 7 | |
| other countries of interest | ||||
| United Kingdom | 7 | 6 | 5 | |
| Korea | 8 | 23 | 23 | |
| Canada | 13 | 8 | 4 | |
| Malaysia | 18 | |||
| Germany | 19 | 25 | 21 | |
| Japan | 20 | 12 | 12 | |
| France | 29 | 31 | 47 | |
| Mexico | 53 | 56 | 62 | |
| Ghana | 63 | |||
| China | 91 | 83 | 108 | |
| India | 132 | 122 | 138 | |
| Brazil | 126 | 122 | 122 | |
The rankings include ranking of various aspects of running a business. Some rankings for 2011: starting a business (New Zealand 1st, Singapore 4th, USA 13th, Japan 107th), Dealing with Construction Permits (Hong Kong 1st, New Zealand 2nd, Singapore 3rd, USA 17th, China 179th), protecting investors (New Zealand 1st, Singapore 2nd, Hong Kong 3rd, Malaysia 4th, USA 5th), enforcing contracts (Luxemburg 1, Korea 2, Iceland 3, Hong Kong 5, USA 7, Singapore 12, China 16, India 182), paying taxes (Maldives 1, Hong Kong 3, Singapore 4, USA 72, Japan 120, China 122, India 147).
These rankings are not the final word on exactly where each country truly ranks but they do provide a valuable source of information. With this type of data there is plenty of room for judgment and issues with the data.
Related: Easiest Countries from Which to Operate Businesses 2008 – Stock Market Capitalization by Country from 1990 to 2010 – Looking at GDP Growth Per Capita for Selected Countries from 1970 to 2010 – Top Manufacturing Countries (2000 to 2010) – Country Rank for Scientific Publications – International Health Care System Performance – Best Research University Rankings (2008)
I have donated more to Tricke Up than any other charity for about 20 years now. There is a great deal of hardship in the world. It can seem like what you do doesn’t make a big dent in the hardship. But effective help makes a huge difference to those involved.
My personality is to think systemically. To help put a band aid on the current visible issue just doesn’t excite me. Lots of people are most excited to help whoever happens to be in their view right now. I care much more about creating systems that will produce benefits over and over into the future. This view is very helpful for an investor.
Trickle Up invests in helping people create better lives for themselves. It provides some assistance and “teaches people to fish” rather than just giving them some fish to help them today.
The stories in this video show examples of the largest potential for entrepreneurship. While creating a few huge visible successes (like Google, Apple…) is exciting the benefits of hundreds of millions of people having small financial success (compared to others) but hugely personally transforming success is more important. Capitalism is visible in these successes. What people often think of as capitalism (Wall Street) has much more resonance with royalty based economic systems than free market (free of market dominating anti-competitive and anti-market behavior) capitalism.
Related: Kiva Loans Give Entrepreneurs a Chance to Succeed – Micro-credit Research – Using Capitalism in Mali to Create Better Lives
400 million people in India and 1.2 billion people worldwide do not have electric power at home. Mera Gao Power provides a wonderful market solution. Mera Gao Power can install solar power systems at a low cost that can be paid back in just 2 years by charging only 50 cents a month to users (for 7 hours of electricity a day). So they provide funding (through investors and grants) and recoup the investment quickly by providing a valuable service at a price users can afford.
Four solar panels are sufficient to power an entire village of 100 households with quality light and mobile charging. These panels are installed on the roofs of existing households, thus eliminating the need for land. Since power is generated during the day and used at night they use batteries to store the power.
By utilizing LED lights, MGP’s micro grid design is ultra energy efficient. This is the key to reducing power generation and storage equipment. Each household is provided with two or four LED lights.
Mera Gao Power received funding from USAID Development Innovation Ventures. The video presents their innovation for a village-level solar micro grid to electrify rural Uttar Pradesh for a White House meeting.
Related: Appropriate Technology: Solar Water Heaters in Poor Cairo Neighborhoods – Top Countries For Renewable Energy Capacity – Water Pump Merry-go-Round – Letting Children Learn, Hole in the Wall Computers – Homemade Windmills for Electricity – Water and Electricity for All
I decided to take a look at some historical economic data to see if some of my beliefs were accurate (largely about how well Singapore has done) and learn a bit more while I was at it.
| country |
|
1970** |
|
2010*** |
|
% increase |
| Korea | 1,320 | 20,200 | 1,430 | |||
| China | 325 | 4,280 | 1,217 | |||
| Singapore | 4260 | 42,650 | 901 | |||
| Indonesia | 460 | 2,960 | 543 | |||
| Brazil | 1900 | 10,500 | 453 | |||
| Thailand | 850 | 4,600 | 441 | |||
| Portugal | 3,970 | 21,000 | 429 | |||
| Japan | 9,000 | 42,300 | 370 | |||
| Malaysia | 1,900 | 7,755 | 308 | |||
| Germany | 11,550 | 40,500 | 251 | |||
| UK | 10,400 | 36,300 | 249 | |||
| France | 13,600 | 40,600 | 199 | |||
| Mexico | 4,160 | 9,200 | 121 | |||
| Panama | 3,480 | 7,700 | 121 | |||
| India | 555 | 1,180 | 113 | |||
| USA | 23,350 | 47,100 | 102 | |||
| South Africa | 3,930 | 7,100 | 81 | |||
| Venezuela | 8,280 | 9,770 | 18 |
I just picked countries that interested me and seemed worth looking at. I looked for some around the starting position of Singapore and close to Singapore geographically. And looked at Panama as the closest match to Singapore (for Singapore’s main 1970 asset, convenient for shipping lanes, and very close for GDP per capita).
Malaysia and Singapore were 1 country after independence (from 1963-1965).
I can’t imagine more than a couple countries could reasonably be argued to have had better economic performance from 1970 to 2010 than Singapore (Korea? China? Who else?). Singapore had very little going for it in 1970. They had a good location for shipping and that is about it macro-economically. No natural resources. No huge storage of wealth. No preeminence in science, technology or business.
It seems to me that Singapore actually did have 1 other thing. A government that was to preside over a fantastic economic growth success. You won’t find many textbooks talking about the way to economic success is a very well run government. And there is good reason for that, I believe. Relying on a very well run government will nearly always fail. In some ways Singapore was like Japan but with significantly more government influence on the way economic development played out.
I was surprised how poorly the USA has faired. It isn’t so surprising that we lagged. People forget how rich the USA was in 1970. The USA is still very rich but bunched together with lots of other rich countries instead of way out ahead as they were in 1970. And in 1970 the lead was already contracting, for what it had been earlier. But even knowing the relative performance of the USA had lagged, I was surprised by how much it under-performed.
I was also surprised with India. I knew they have done poorly but I didn’t realize it had been this poor. The failures to greatly improve infrastructure, education and the stifling effect of their bureaucracy have been causing them great harm. They have been doing some good things in the last 10 years especially but still have a long way to go. Their premier education is actually pretty decent. The problem is the other 90% of the education is often poor and many people (especially women) hardly have any education at all. It is very hard to get ahead when you fail to take advantage of the talents of so many of your people.
Related: Singapore and Iskandar Malaysia – Chart of Largest Petroleum Consuming Countries from 1980 to 2010 – Chart of Nuclear Power Production by Country from 1985-2009 – Top Countries For Renewable Energy Capacity