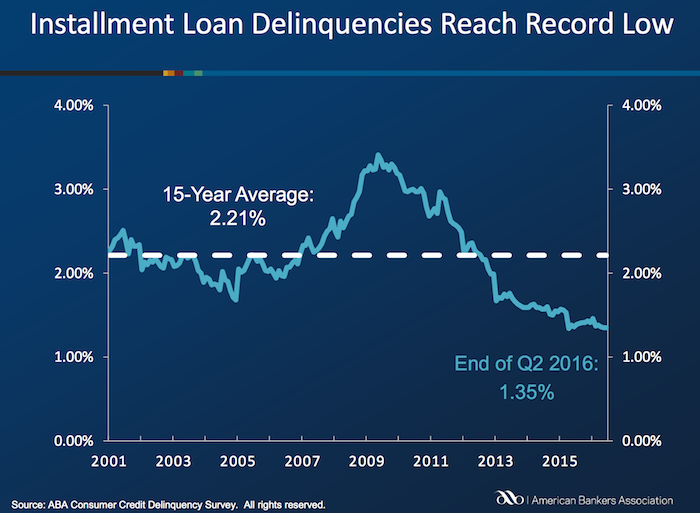
Delinquencies in closed-end loans fell slightly in the second quarter, driven by a drop in home equity loan delinquencies, according to results from the American Bankers Association’s Consumer Credit Delinquency Bulletin.
The composite ratio, which tracks delinquencies in eight closed-end installment loan categories, fell 3 basis points to 1.35% of all accounts – a record low. This also marked the third year that delinquency rates were below the 15-year average of 2.21%. The ABA report defines a delinquency as a late payment that is 30 days or more overdue. This is good news but the personal financial health of consumers in the USA is still in need of significantly improvements to their balance sheets. Debt levels are still too high. Savings levels are still far to low.
Home equity loan delinquencies fell 4 basis points to 2.70% of all accounts, which helped drive the composite ratio down. Other home related delinquencies increased slightly, with home equity line delinquencies rising 6 basis points to 1.21% of all accounts and property improvement loan delinquencies rising 2 basis points to 0.91% of all accounts. Home equity loan delinquencies dipped further below their 15-year average of 2.85%, while home equity line delinquencies remained just above their 15-year average of 1.15 percent.
Bank card delinquencies edged up 1 basis point to 2.48% of all accounts in the second quarter. They remain significantly below their 15-year average of 3.70 percent.
The second quarter 2016 composite ratio is made up of the following eight closed-end loans. All figures are seasonally adjusted based upon the number of accounts.
Closed-end loans
Home equity loan delinquencies fell from 2.74% to 2.70%.
Mobile home delinquencies fell from 3.41% to 3.17%.
Personal loan delinquencies fell from 1.44% to 1.43%.
Direct auto loan delinquencies rose from 0.81% to 0.82%.
Indirect auto loan delinquencies rose from 1.45% to 1.56%.
Marine loan delinquencies rose from 1.03% to 1.23%.
Property improvement loan delinquencies rose from 0.89% to 0.91%.
RV loan delinquencies rose from 0.92% to 0.96%.
Open-end loans
Bank card delinquencies rose from 2.47% to 2.48%.
Home equity lines of credit delinquencies rose from 1.15% to 1.21%.
Non-card revolving loan delinquencies rose from 1.57% to 1.65%.
Related: Debt Collection Increasing Given Large Personal Debt Levels (2014) – Consumer and Real Estate Loan Delinquency Rates from 2001 to 2011 in the USA – Good News: Credit Card Delinquencies at 17 Year Low (2011) – Real Estate and Consumer Loan Delinquency Rates 1998-2009 – The USA Economy Needs to Reduce Personal and Government Debt (2009)
BenefitsCheckUp is a free service of the National Council on Aging. Many adults over 55 need help paying for prescription drugs, health care, utilities, and other basic needs. There are over 2,000 federal, state and private benefits programs available to help those living in the USA. But many people don’t know these programs exist or how they can apply.
BenefitsCheckUp asks a series of questions to help identify benefits that could save you money and cover the costs of everyday expenses in areas such as:
- Medications
- Food
- Utilities
- Legal
- Health care
- Housing
- Taxes
- Transportation
- Employment Training
While the National Council on Aging is focused on benefits for older people the service actually finds many sources that are not dependent on age.
If you complete the overall questionnaire it is fairly long (about 30 questions) but still can be completed in 10 minutes. Also you can target your request (say to health care) and have a shorter questionnaire. They will provide links and contact information to various programs you may qualify for based on your answers.
Related: Disability Insurance is Very Important – Personal Finance, Minimal Budgeting – Truly Free Credit Report – Manage Your Borrowing and Avoid Debt Negotiators
When I lived in Malaysia I learned that the residential electricity rates were very low for the low levels of use and climbed fairly rapidly as you used a lot of electricity (say running your air conditioner a lot). I think this is a very good idea (especially for the not yet rich countries). In rich countries even most of the “poor” have high use of electricity and it isn’t a huge economic hardship to pay the costs.
Effectively the rich end up subsidizing the low rates for the poor, which is a very sensible setup it seems to me. The market functions fairly well even though it is distorted a bit to let the poor (or anyone that uses very little electricity) to pay low rates.
In a country like Malaysia as people become rich they may well decide to use a great deal of electricity for air conditioning (it is in the tropics). But their ancestors didn’t have that luxury and having that be costly seems sensible to me. Allowing the poor to have access to cheap electricity is a very good thing with many positive externalities. And subsidizing the rate seems to be a good idea to me.
Often you get bad distortions in how markets work when you try to use things like subsidies (this post is expanded from a comment I made on Reddit discussing massive bad investments created by free electricity from the power company to city governments – including free electricity to their profit making enterprises, such as ice rinks in Puerto Rico).

View of downtown Johor Bahru from my condo (a small view of Singapore visible is in the background)
With the model of low residential rates for low usage you encourage people to use less electricity but you allow everyone to have access at a low cost (which is important in poor or medium income countries). And as people use more they have to pay higher rates (per kwh) and those rates allow the power company to make a profit and fund expansion. Often in developing countries the power company will be semi-private so the government is involved in providing capital and sharing in profits (as well as stockholders).
The USA mainly uses central air conditioning everywhere. In Malaysia, and most of the world actually, normally they just have AC units in some of the rooms. In poor houses they may well have none. In middle class houses they may have a one or a couple rooms with AC units.
Even in luxury condos (and houses) they will have some rooms without AC at all. I never saw a condo or house with AC for the kitchen or bathrooms. The design was definitely setup to use AC in fairly minimal ways. The hallways, stairways etc. for the “interior” of the high rise condos were also not air conditioned (they were open to the outside to get good air flow). Of course as more people become rich there is more and more use of AC.
Related: Traveling for Health Care – Expectations – Looking at the Malaysian Economy (2013) – Pursuing a Growing Economy While Avoiding the Pitfalls That Befall to Many Middle Income Countries – Singapore and Iskandar Malaysia – Looking at GDP Growth Per Capita for Selected Countries from 1970 to 2010 – Malaysian Economy Continues to Expand, Budget Deficits Remain High (2012) – Iskandar Malaysia Housing Real Estate Investment Considerations (2011)
Credit scores are far from a great measure of whether a person is a great credit risk for a specific loan, in my opinion. However, they are very widely used and therefor, very important. They also are somewhat useful. And lenders don’t base judgement solely on credit scores, they consider many other factors, if they have any sense at all.
Credit scores range from 300 to 850. They are calculated by various credit reporting organizations, including FICO. They factor in payment history, percent of outstanding credit available that is used, credit report checks, length of outstanding credit accounts, etc..
Metlife report on consumers and credit scores provides some interesting data.
| Credit score range | Default rate* |
|---|---|
| 740-850 | .4% |
| 680-739 | 2.8% |
| 620-679 | 7.5% |
| 550-619 | 17% |
| 300-459 | 33.8% |
* Default rate in this case means, 90 days past due. MetLife got this data from the Consumer Financial Health Study dataset**.
Peer to peer lending platform, Lending Club, limits loans to those with a minimum credit score of 660 (remember there are multiple organizations that provide credit scores, this minimum is based on Lending Club’s score). In general I see scores above 700 in A and B loans, scores from 650-700 in C and D loans. Remember the credit score is not the only factor setting the rate (you will see scores above 700 in the C loans sometimes, etc.). Credit scores provide some insight but are just 1 factor in approving loans or setting rates (an important one but not a completely dominant one).
About 38% of people have credit scores from 750-850. Another 37% from 600-749 and about 25% from 350-599.
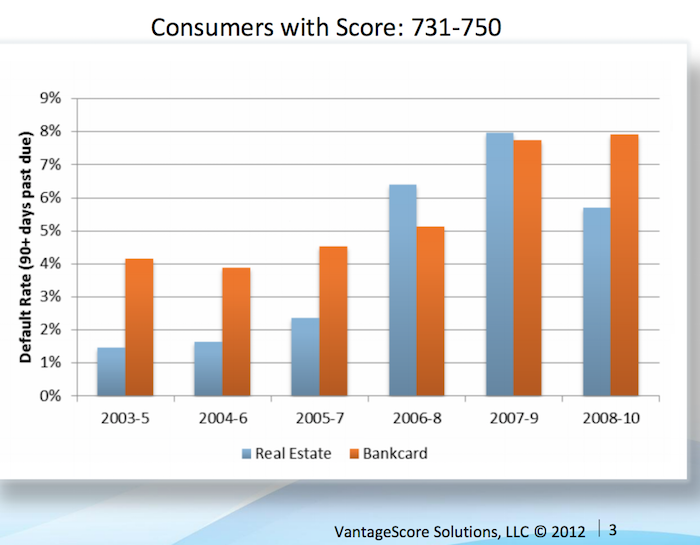
Vantage Score decided to make their score range go up to 1000, not the standard 850. Maybe a 750 score for them is comparable to 680? They say super-prime is 900+ (750-850 on more common scale), prime is 701-900 (680-739), near-prime 641-700 (620-679), subprime 501-640 (550-619). Anyway that chart shows the changing default rates from 2003 to 2010 by type of loan.
This Federal Reserve report on meeting between Federal Reserve Board staff and Fair Isaac Corporation (FICO) 20 June 2013 has some interesting material.
For guidance, the following table generally matches a borrower’s odds-of-default with the corresponding FICO 8 score (calculated on performance from Oct 2008 – Oct 2010). Of course, the range of scores and odds-of-default [the data is related to mortgages] will vary with each model as creditors develop and validate their own credit scoring models.
Odds-of Default FICO 8 Score percent of population** 5:1 610 9% 10:1 645 9% 20:1 685 6% 30:1 705 6% 40:1 720 6% 50:1 735 9% 100:1 770 30%
As you can see at a 610 level, 20 loans out of 100 defaulted. At 685 just 5 in 100 defaulted and at 770 just 1 in 100 did.
** I had to adjust this, because the report didn’t report it in this form, so it a very approximate measure (I made estimates for something like scores from 735 to 769 etc.). Again this is data from the Oct 2008 – Oct 2010 period. The rest of the population (about 25%) would have scores below 610.
Related: The Impact of Credit Scores and Jumbo Size on Mortgage Rates (2009) – Your FICO credit score explained – $2,540,000,000,000 in USA Consumer Debt
This page references a Fed report (that I can’t find) that found the following default rates on new loans for the two years after origination, 2000-2002:
| Credit score range | Default rate* |
|---|---|
| under 520 | 41% |
| 520-559 | 28% |
| 560-599 | 23% |
| 600-639 | 16% |
| 640-679 | 9% |
| 680-719 | 4.4% |
| over 720 | <1% |
The Consumer Financial Health Study respondents were asked to self-assess their credit quality and for permission to pull their actual credit scores.8 Forty-five percent of survey participants granted permission, yielding an “opt-in” sample size of 3,215. We appended two objective measures of creditworthiness to the dataset: Experian provided VantageScore 3.0 credit scores, and LexisNexis Risk Solutions provided RiskView scores. VantageScore is a generic credit scoring model that was created by the three major credit bureaus (Equifax, Experian and TransUnion) and, in addition to tradeline data, includes rent, utility and cell phone payment data when it is available in consumer credit files.
Health insurance options are confusing for those of us in the USA (those outside the USA are free of the frustrations of USA health care system). One of the features of a health insurance plan in the USA is the out-of-pocket “maximum.”
Now if you think you understand english you might think this is the maximum you have to pay out of your pocket. If you understand how horrible the USA health care system is and how nothing is easy, you probably suspect it isn’t a maximum at all. I find myself thinking that I don’t really understand what this seemingly simple value actually means, so I decided to research it and write this blog post.
First of all you have to pay the monthly premiums (assuming your employer doesn’t pay them for you), probably a few hundred or more dollars every month. Then the coverage likely has a deductible maximum for the year.
For this example, for 1 person the insurance costs $300/month with a yearly deductible maximum of $5,000. And the insurance plan says there is an out-of-pocket “maximum” of $6,500. Well 12 *$300 + $5,000 = $8,600. So, as you can probably guess, out-of-pocket “maximum” doesn’t actually mean the maximum out of your pocket. In fact the $8,600 is excluded from the out-of-pocket maximum calculation altogether.
So, you then might think ok, my actual out-of-pocket maximum (the most I will have to pay all year for health care) is $8,600 + $6,500 = $15,100. But that isn’t right either.
First, this is only for covered medical expenses, uncovered medical expenses are not included. This makes some sense, certainly, but in your planning, you can’t think your health care costs are capped at $15,100. Especially since in the USA lots of health care will be uncovered (dental care is often excluded, mental health care may well be limited, certain types of treatment may not be covered, prescription glasses, non-prescription drugs, addiction treatment…).
Remember, USA health care coverage isn’t even just limited by the type of care. For example, even if fixing your injured leg is covered, if you don’t do it using exactly the right places (where your health plan covers the cost), it may be considered to be uncovered care. In general, emergency care is more flexible for what is covered, but the horror stories of dealing with health insurers refusal to pay for provided health care adds risk to any health care someone gets in the USA.
Here is a good explanation of out-of-pocket cost questions (in this quote looking at out of network costs): “Out of Pocket Maximum” and health insurance plan terminology and calculation?
Peer to peer lending has grown dramatically the last few years in the USA. The largest platforms are Lending Club (you get a $25 bonus if you sign up with this link – I don’t think I get anything?) and Prosper. I finally tried out Lending Club starting about 6 months ago. The idea is very simple, you buy fractional portions of personal loans. The loans are largely to consolidate debts and also for things such as a home improvement, major purchase, health care, etc.).
With each loan you may lend as little as $25. Lending Club (and Prosper) deal with all the underwriting, collecting payments etc.. Lending Club takes 1% of payments as a fee charged to the lenders (they also take fees from the borrowers).
Borrowers can make prepayments without penalty. Lending Club waives the 1% fee on prepayments made in the first year. This may seem a minor point, and it is really, but a bit less minor than I would have guessed. I have had 2% of loans prepaid with only an average of 3 months holding time so far – much higher than I would have guessed.
On each loan you receive the payments (less a 1% fee to Lending Club) as they are made each month. Those payments include principle and interest.

This chart shows the historical performance by grade for all issued loans that were issued 18 months or more before the last day of the most recently completed quarter. Adjusted Net Annualized Return (“Adjusted NAR”) is a cumulative, annualized measure of the return on all of the money invested in loans over the life of those loans, with an adjustment for estimated future losses. From LendingClub web site Nov 2015, see their site for updated data.
Lending Club provides you a calculated interest rate based on your actual portfolio. This is nice but it is a bit overstated in that they calculate the rate based only on invested funds. So funds that are not allocated to a loan (while they earn no interest) are not factored in to your return (though they actually reduce your return). And even once funds are allocated the actual loan can take quite some time to be issued. Some are issued within a day but also I have had many take weeks to issue (and some will fail to issue after weeks of sitting idle). I wouldn’t be surprised if Lending Club doesn’t start considering funds invested until the loan is issued (which again would inflate your reported return compared to a real return), but I am not sure how Lending Club factors it in.
This chart shows that the percentage of millionaire families by highest education level is dramatically different by education level. The data is looking at USA family income for household headed by a person over 40. For high school dropouts, fewer than 1% are millionaires; all families it is about 5%; high school graduates about 6%; 4 year college degree about 22% and graduate or professional degree about 38%.

Interesting chart based on Federal Reserve data (via the Wall Street Journal)
While the costs of higher education in the USA have become crazy the evidence still suggests education is highly correlated to income. Numerous studies still show that the investment in education pays a high return. Of course, simple correlation isn’t sufficient to make that judgement but in other studies they have attempted to use more accurate measures of the value of education to life long earnings.
Related: The Time to Payback the Investment in a College Education in the USA Today is Nearly as Low as Ever, Surprisingly – Looking at the Value of Different College Degrees – Engineering Graduates Earned a Return on Their Investment In Education of 21%
The blog post with the chart, Why Wealth Inequality Is Way More Complicated Than Just Rich and Poor has other very interesting data. Go read the full post.
Average isn’t a very good measure for economic wealth data, is is skewed horribly by the extremely wealthy, median isn’t a perfect measure but it is much better. The post includes a chart of average wealth by age which is interesting though I think the $ amounts are largely worthless (due to average being so pointless). The interesting point is there is a pretty straight line climb to a maximum at 62 and then a decline that is about as rapid as the climb in wealth.
That decline is slow for a bit, dropping, but slowly until about 70 when it drops fairly quickly. It isn’t an amazing result but still interesting. It would be nice to see this with median levels and then averaged over a 20 year period. The chart they show tells the results for some point in time (it isn’t indicated) but doesn’t give you an idea if this is a consistent result over time or something special about the measurement at the time.
They also do have a chart showing absolute wealth data as median and average to show how distorted an average is. For example, median wealth for whites 55-64 and above 65 is about $280,000 and the average for both is about $1,000,000.
Related: Highest Paying Fields at Mid Career in USA: Engineering, Science and Math – Wealthiest 1% Continue Dramatic Gains Compared to Everyone Else – Correlation is Not Causation: “Fat is Catching” Theory Exposed
European government debt has been sold at negative interest rates recently. The United States Treasury has now come as close to that as possible with 0% 3 month T-bills in the latest auction.
The incredible policies that have created such loose credit has the world so flooded with money searching for somewhere to go that 0% is seen as attractive. This excess cash is dangerous. It is a condition that makes bubbles inflate.
Low interest rates are good for businesses seeking capital to invest. These super low rates for so long are almost certainly creating much more debt for no good purpose. And likely even very bad purposes since cash is so cheap.
One thing I didn’t realize until last month was that while the USA Federal Reserve stopped pouring additional capital into the markets by buying billions of dollars in government every month they are not taking the interest and maturing securities and reducing the massive balance sheet they have. They are actually reinvesting the interest (so in fact increasing the debt load they carry) and buying more debt anytime debt instruments they hold come due.
The Fed should stop buying even more debt than they already hold. They should not reinvest income they receive. They should reduce their balance sheet by at least $1,500,000,000,000 before they consider buying new debt.
Unless the failure to address too-big-to-fail actions (and systems that allow such action) results in another great depression threat. And if that happens again they should not take action until people responsible are sitting in jail without the possibly of bail. The last bailout just resulted in transferring billions of dollars from retires and other savers to the pockets of those creating the crisis. Doing that again when we knew that was fairly likely without changing the practices of the too-big-to-fail banks. But I would guess we will just bail them out while they sit in one of the many castles their actions at the too-big-to-fail banks bought them and big showered with more cash in the bailout from the next crisis.
How to invest in these difficult times is not an easy question to answer. I would put more money in stocks for yield (real estate investment trusts, drug companies, dividend aristocrats), I would also keep cash even if it yields 0% and actually a new category for me – peer to peer lending (which I will write about soon). Recently many dividend stocks have been sold off quite a bit (and then on top of that drug stocks sold off) so they are a much better buy today than 4 months ago. Still nothing is easy in what I see as a market with much more risk than normal.
I am almost never a fan of long term debt. I would avoid it nearly completely today (if not completely). For people that are retired and living off their dividends and interest I may have some long term debt but I would have much more in cash and short term assets (even with the very low yields). Peer to peer lending has risks but given what the fed has done to savers I would take that risk to get the larger yields. The main risk I worry about is the underwriting risk – the economic risks are fairly well known, but it is very hard to tell if the lender starts doing a poor job of underwriting.
Related: The Fed Should Raise the Fed Funds Rate – Too-Big-to-Fail Bank Created Great Recession Cost Average USA Households $50,000 to $120,000 – Buffett Calls on Bank CEOs and Boards to be Held Responsible – Historical Stock Returns
The number of USA households spending more than 50% of their income on rent is expected to rise at least 11% to 13.1 million by 2025, according to new research by Harvard University’s Joint Center for Housing Studies and Enterprise Community Partners.
The findings suggest that even if trends in incomes and rents turn more favorable, a variety of demographic forces—including the rapid growth of minority and senior populations—will exert continued upward pressure on the number of severely cost-burdened renters.
Under the report’s base case scenario for 2015-2025, the number of severely burdened households aged 65-74 and those aged 75 and older rise by 42% (830,000 to 1.2 million) and 39% (890,000 to 1.2 million); the number of Hispanic households with severe renter burdens increases 27% (2.6 million to 3.4 million); and the number of severely burdened single-person households jumps by 12% (5.1 million to 5.7 million).

Graph from the report. The blip of an improvement from 2010 to 2013 is due to the decline in home ownership which changed the makeup of the “rental population.” Moderate (severe)
burdens are defined as housing costs of 30–50% (more than 50%) of household income. Households with zero or negative income are assumed 30 to be severely burdened, while renters not paying cash rent are assumed to be unburdened.
Enterprise Community Partners argues for more government action on affordable housing. I am worried about such efforts being done in a sensible way but I do agree with the concept of supporting affordable housing. I would use zoning to require affordable housing construction along with market rate housing.
Doing such things well requires a government that is not corrupt and fairly competent which isn’t so easy looking across the USA (unfortunately). An example of somewhere that does this fairly well is Arlington Country, Virginia (which also has a good non-profit focused on affordable housing). Good non-profits can play a vital part in affordable housing over the long term.
Credit is the ability to buy now and pay later. It takes credit to get an auto loan, a mortgage and other types of financing. Your credit score says a lot about your credit habits. This is a three-digit number ranging from 300 to 850, and it tells creditors how likely you are to pay your bills. The higher your credit score, the better your chances of getting approved for financing and the lower your interest rate will be.
Credit has many benefits. Most people can’t pay cash for homes, college education or new cars. Without loans, buying a house or car would be impossible for many. And since it takes credit to build credit, many people apply for their first credit card in college to establish a credit history. A credit card also provides emergency funds when we’re short on cash.
Although we use credit regularly as consumers, there are dangers associated with credit. We can avoid some of these problems with responsible use. But unfortunately, credit management education isn’t taught in high school, and many adults don’t learn about credit management until after they’ve made mistakes.
Potential Dangers of Credit
Credit puts a lot of things within our financial reach, so it’s easy to get in over our heads. We might not have enough in savings to purchase an electronic device or take a vacation, but with one quick application, we can get approved for financing and take advantage of life’s pleasures. There’s nothing wrong with getting a loan. But some people can’t stop using credit and they get into serious debt.
Too much debt has a significant negative impact on your personal finances. Paying off that debt will reduce your available disposable income to build an emergency fund (if you haven’t done so already) or save for retirement a house or other large purchases.
Of course, debt isn’t the only thing to be concerned with. Getting credit also means you’re vulnerable to identity theft. This is one of the fastest growing crimes in the U.S. And while some people think it can’t happen to them, no one is invincible.
Keeping Your Credit Report Accurate
Identity theft involves someone stealing your personal information and purchasing items in your name or opening new accounts in your name. It can drive down your credit score and take several months or years to fix. Identity theft often goes unnoticed because some people never monitor their personal credit reports or file credit disputes
You might wonder, what is a credit dispute? As a consumer, you have the right to check your credit history and receive one free credit report from each of the bureaus annually. You are entitled to ask questions about anything included within your credit reports.Â