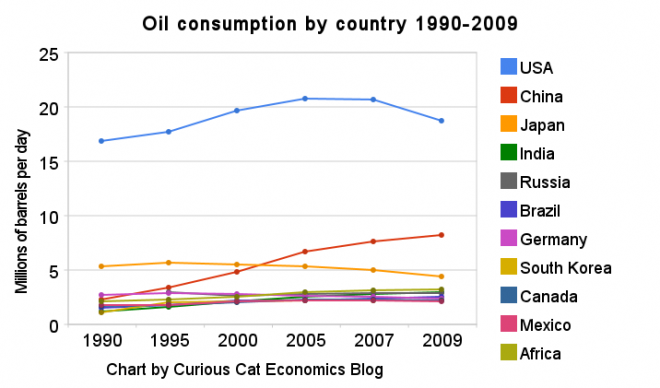
The United States uses far more oil than any other country. The chart shows this very well. The chart shows all countries using over 2 million barrels of oil a day. The USA consumed 18.7 million barrels a day in 2009. Only China was also over 5 million barrels, they reached 8.2 million in 2009. Japan is next at 4.4 million.

The data is from the US Department of Energy for total consumption of petroleum products.
Mexico, Canada, South Korea, Germany, Brazil, Russia and India all use between 2 and 3 million barrels a day. All of Africa is at 3.2 million.
Related: Oil Consumption by Country in 2007 – Manufacturing output by Country 1990-2008 – Increasing USA Foreign Oil Dependence In The Last 40 years – Wind Power Capacity Up 170% Worldwide from 2005-2009
Comments
5 Comments so far
GREAT and telling CHART! Thanks for taking the time to put it together.
The chart show 3 clear leaders in production Russia, Saudi Arabia and the USA (with the USA firmly in 3rd place). Those 3 were responsible for approximately a third of the total oil production in 2009…
Nuclear power provided 14% of the world’s electricity in 2009… From 1985 to 2009, USA production increased 108%, France 84% and Japan 77%… Globally nuclear power production increased 80% from 1985 to 2009.
Top countries for installed renewable energy capacity: China 103.4gw, USA 58gw, Germany 48.9gw, Spain 27.8gw, Japan 26 gw, India 18.7gw..
In 2007 wind energy capacity reached 1% of global electricity needs. In just 4 years wind energy capacity has grown to reach 2.5% of global electricity demand. And by the end of 2011 it will be close to 3%…