Across the globe, saving for retirement is a challenge. Longer lives and expensive health care create challenge to our natures (saving for far away needs is not easy for most of us to do – we are like the grasshopper not the ants, we play in the summer instead of saving). This varies across the globe, in Japan and China they save far more than in the USA for example.
The United States of America ranks 19th worldwide in the retirement security of its citizens, according to a new Natixis Global Retirement Index. The findings suggest that Americans will need to pick up a bigger share of their retirement costs – especially as the number of retirees grows and the government’s ability to
support them fades. The gauges how well retired citizens live in 150 nations, based on measures of health, material well-being, finances and other factors.
Top Countries for Retirees
- 1 – Norway
- 2 – Switzerland
- 3 – Luxembourg
- 6 – Finland
- 9 – Germany
- 10 – France
- 11 – Australia
- 13 – Canada
- 15 – Japan
- 19 – USA
- 20 – United Kingdom
Western European nations – backed by robust health care and retiree social programs – dominate the top of the rankings, taking the first 10 spots, including Sweden, Austria, Netherlands and Denmark. The USA finished ahead of the United Kingdom, but trailed the Czech Republic and Slovakia.
Globally, the number of people aged 65 or older is on track to triple by 2050. By that time, the ratio of the working-age population to those over 65 in the USA is expected to drop from 5-to-1 to 2.8-to-1. The USA actually does much better demographically (not aging as quickly) as other rich countries mainly due to immigration. Slowing immigration going forward would make this problem worse (and does now for countries like Japan that have very restrictive immigration policies).
The economic downturn has taken a major toll on retirement savings. According to a recent report by the U.S. Senate Committee on Health, Education, Labor and Pensions, the country is facing a retirement savings deficit of $6.6 trillion, or nearly $57,000 per household. As a result, 53% of American workers 30 and older are on a path that will leave them unprepared for retirement, up significantly from 38% in 2011.
On another blog I recently wrote about another study looking at the Best Countries to Retirement Too: Ecuador, Panama, Malaysia. The study in the case was looking not at the overall state of retirees that worked in the country (as the study discussed in this post did) but instead where expat retirees find good options (which stretch limited retirement savings along with other benefits to retirees).
See the full press release.
Related: Top Stock Market Capitalization by Country from 1990 to 2010 – Easiest Countries in Which to Operate a Businesses: Singapore, Hong Kong, New Zealand, USA – Largest Nuclear Power Generation Countries from 1985-2010 – Leading countries for Economic Freedom: Hong Kong, Singapore, New Zealand, Switzerland – Countries with the Top Manufacturing Production
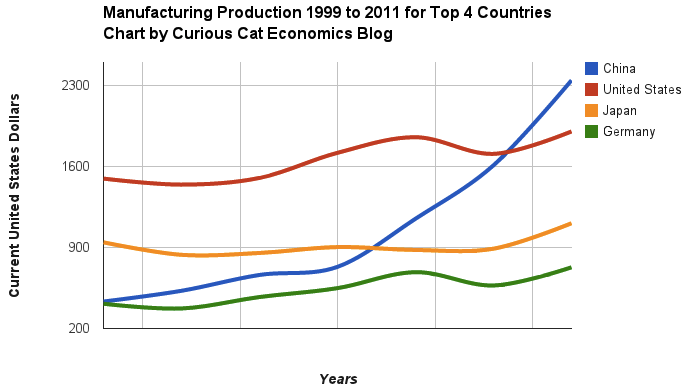
Chart of manufacturing production by China, USA, Japan and Germany from 1999 to 2011. The chart was created by the Curious Cat Economics Blog using UN data. You may use the chart with attribution. All data is shown in current USD (United States Dollar).
The story of global manufacturing production continues to be China’s growth, which is the conventional wisdom. The conventional wisdom however is not correct in the belief that the USA has failed. China shot past the USA, which dropped into 2nd place, but the USA still manufactures a great deal and has continually increased output (though very slowly in the last few years).
The story is pretty much the same as I have been writing for 8 years now. The biggest difference in that story is just that China actually finally moved into 1st place in 2010 and, maybe, the slowing of the USA growth in output (if that continues, I think the USA growth will improve). I said last year, that I expected China to build on the lead it finally took, and they did so. I expect that to continue, but I also wouldn’t be surprised to see China’s momentum slow (especially a few more years out – it may not slow for 3 or 4 more years).
As before, the four leading nations for manufacturing production remain solidly ahead of all the rest. Korea and Italy had manufacturing output of $313 billion in 2011 and Brazil moved up to $308 are in 4-6 place. Those 3 countries together could be in 4th place (ahead of just Germany). Even adding Korea and Italy together the total is short of Germany by $103 in 2011). I would expect Korea and Brazil to grow manufacturing output substantially more than Italy in the next 5 years.
Total nonfarm payroll employment increased by 157,000 in January, and the unemployment rate was essentially unchanged at 7.9%, the USA Bureau of Labor Statistics reported today. The change in total nonfarm payroll employment for November was revised from +161,000 to +247,000, and the change for December was revised from +155,000 to +196,000 which means this report shows an increase of 284,000 (157+86+41). In 2012, employment growth averaged 181,000 per month.
The number of unemployed persons, at 12.3 million, was little changed in January. The
unemployment rate was 7.9% and has been at or near that level since September 2012.
Among the major worker groups, the unemployment rates for adult men (7.3%), adult women (7.3%), teenagers (23.4%), whites (7.0%), african-american (13.8%), Hispanics (9.7%), and Asians (6.5%) showed little or no change in January.
In January, the number of long-term unemployed (those jobless for 27 weeks or more) was about unchanged at 4.7 million and accounted for 38.1% of the unemployed. The continued high level of long term unemployment is a continuing concern.
Health care continued to add jobs in January (+23,000). Within health care, job growth occurred in ambulatory health care services (+28,000), which includes doctors’ offices and outpatient care centers. In the last year, health care employment has increased by 320,000.
Manufacturing employment was essentially unchanged in January and has changed little, on net, since July 2012.
Average hourly earnings for all employees on private nonfarm payrolls rose by 4 cents to $23.78. Over the year, average hourly earnings have risen by 2.1 percent. In January, average hourly earnings of private-sector production and nonsupervisory employees increased by 5 cents to $19.97.
Related: 243,000 Jobs Added in January 2012 to Bring the USA Unemployment Rate Down to 8.3% – USA Unemployment Rate Remains at 9.7% (Feb 2010) – What Do Unemployment Stats Mean?
A recent report by Deloitte, The Hidden Costs of U.S. Health Care: Consumer Discretionary Health Care Spending provides some interesting data.
Between 2006 and 2010 USA health care expenditures increased by 19%. Government spending accounted for 40% of costs (remember that figure is lowered due to Deloitte’s including inputed value for care of relatives). Those 65 and older account for 61% of the inputed cost care that is provided.
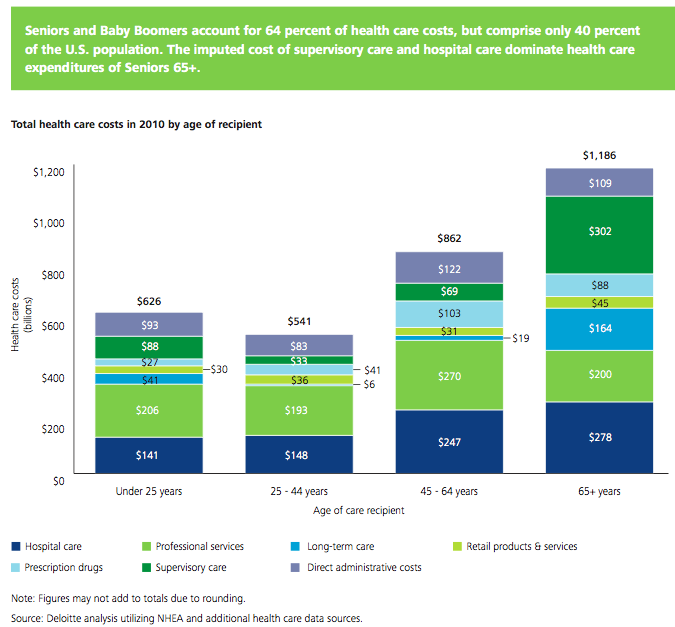
Seniors and baby boomers account for 64% of health care costs, but comprise only 40% of the USA population. The imputed cost of supervisory care and hospital care are far higher proportions of health care expenditures of seniors (65 and older).
I find this imputed value largely not worth considering. There are problems with the way we count GDP and economic activity (that affect health care and lots of other things). It is fine to be aware that they think $492 billion of extra care is given by family members but using that figure in any sensible way (other than saying hey there is a huge cost in people’s time to dealing with our health care system and sick people that isn’t counted in economic data) is questionable.
It is useful in looking at the increasingly old population we will see in the future and judging their is a large need for supervisory care that is not captured in just looking at the costs included in economic data currently. Not only will our grandkids have to pay for our living beyond our means today they will have to do so while providing unpaid care to their parents and grandparents.
The burden of long term supervisor care (that which can be provided by a non-health care professional) is one reason a resurgence in multi-generation housing options make sense to me. There are other good reasons also (child care, socialization, financial support to the young…). There are some real advantages and real disadvantages to such options. But I think economic advantages are going to encourage more of this going forward.
Related: Personal Finance Basics: Long-term Care Insurance – Health Care in the USA Cost 17.9% of GDP, $2.6 Trillion, $8,402 per person in 2010 – Resources for Improving Health Care System Performance
Total nonfarm payroll employment increased by 171,000 in October, and the unemployment rate increased at 7.9%, the U.S. Bureau of Labor Statistics reported today. Employment rose in professional and business services, health care, and retail trade. The change in total nonfarm payroll employment for August was revised from +142,000 to +192,000, and the change for September was revised from +114,000 to +148,000.
So with this report another 255,000 (171 + 50 + 34) were added, quite a good number. If we could see 250,000 jobs added for 12 more months that would be quite nice – though still will not have recovered all the jobs cost by the too-big-too-fail credit crisis.
Employment growth has averaged 157,000 per month thus far in 2012, about the same as the average monthly gain of 153,000 in 2011.
Hurricane Sandy had no discernable effect on the employment and unemployment data for October. Household survey data collection was completed before the storm, and establishment survey data collection rates were within normal ranges nationally and for the affected areas.
Long-term unemployment remains a problem, in October, the number of long-term unemployed (those jobless for 27 weeks or more) was little changed at 5.0 million. These individuals accounted for 40.6% of the unemployed (a higher percentage than normal – as it has been for the duration of the too-big-too-fail job recession.
The civilian labor force rose by 578,000 to 155.6 million in October, and the labor force participation rate edged up to 63.8%. Total employment rose by 410,000 over the month (I am guessing this is not seasonally adjusted – the highlighted figures normally quotes are seasonally adjusted figures). The employment-population ratio was essentially unchanged at 58.8%, following an increase of 40 basis points in September.
Related: Unemployment Rate Reached 10.2% (Oct 2009) – USA Economy Adds 151,000 Jobs in October and Revisions Add 110,000 More (Oct 2010, unemployment rate at 9.6%) – USA Unemployment Rate Drops to 8.6% (Nov 2011) – USA Lost Over 500,000 Jobs in November, 2008
Manufacturing employment is on a long term decline, in the USA and the world. The massive increases in productivity allow fewer and fewer people to produce more and more good. This is a good thing as it allows us to afford more good with less cost. But it does mean fewer manufacturing jobs, which are very good jobs, exist. This is a shame but something we shouldn’t anticipate changing. Believing we will globally, or in the USA, return to the huge number of manufacturing that were available previously jobs is not a wise conclusion to reach. Certainly there can be short term fluctuations that lead to increased jobs – that has happened in the last year for example.
")
The most surprising thing to me about this graph is how stable employment was through 2000. From 1980 to 2000 the most common idea was the USA no longer manufactured anything. This idea was wrong, as I have written about previously: Chart of top 15 countries manufacturing output over time (2009) – Top 10 manufacturing countries in 2006. But I did think employment declined more from 1970 to 2000.
One factor in this perception is that the number of employed people in the USA has continued to grow. So even remaining somewhat stable from 1970 to 2000, as a percentage of the labor force the jobs kept shrinking. The more important factor that played on people emotionally is factories being shut down got much more attention in the news than new jobs being added. So the perception was tons of jobs were being lost and none were being gained.
The unemployment rate decreased to 7.8%, and total nonfarm payroll employment rose by 114,000 in September, the U.S. Bureau of Labor Statistics reported today. The change in total nonfarm payroll employment for July was revised from +141,000 to +181,000, and the change for August was revised from +96,000 to +142,000. Thus, with this report 200,000 new jobs were added (114,000 + 40,000 + 46,000).
The unemployment rate declined from 8.1% in August to 7.8% in September. For the first 8 months of the year, the rate held within a narrow range of 8.1 and 8.3%. The number of unemployed persons, at 12.1 million, decreased by 456,000 in September.
The number of long-term unemployed (those jobless for 27 weeks or more) was little changed at 4.8 million and accounted for 40.1% of the unemployed. This remains one of the most serious problems – along with the less that strong job creation numbers (since the too-big-too-fail financial crisis kicked off the great recession). In 2012, employment growth has averaged 146,000 per month, compared with an average monthly gain of 153,000 in 2011. 150,000 is decent but because of the huge job losses in the 4 years prior to 2011 there is a big recovery needed. Adding above 225,000 jobs a month, for years, would be a good result and put the economy on much firmer ground.
Health care added 44,000 jobs in September. Job gains continued in ambulatory health care services (+30,000) and hospitals (+8,000). Over the past year, employment in health care has risen by 295,000.
The average workweek for all employees on private nonfarm payrolls edged up by 0.1 hour to 34.5 hours in September. The manufacturing workweek edged up by 0.1 hour to 40.6 hours, and factory overtime was unchanged at 3.2 hours. The average workweek for production and nonsupervisory employees on private nonfarm payrolls was unchanged at 33.7 hours.
In September, average hourly earnings for all employees on private nonfarm payrolls rose by 7 cents to $23.58. Over the past 12 months, average hourly earnings have risen by 1.8 percent. In September, average hourly earnings of private-sector production and nonsupervisory employees increased by 5 cents to $19.81.
Related: Bad Jobs News in the USA, Unemployment Remains at 9.1% (Sep 2011) – USA Unemployment Rate at 9.6% (Sep 2010) – Unemployment Rate Increases to 9.7% (Sep 2009) – Over 500,000 Jobs Disappeared in November 2008
The largest manufacturing countries are China, USA, Japan and then Germany. These 4 are far in the lead, and very firmly in their positions. Only the USA and China are close, and the momentum of China is likely moving it quickly ahead – even with their current struggles.
The chart below shows manufacturing production by country as a percent of GDP of the 10 countries that manufacture the most. China has over 30% of the GDP from manufacturing, though the GDP share fell dramatically from 2005 and is solidly in the lead.
Nearly every country is decreasing the percentage of their economic output from manufacturing. Korea is the only exception, in this group. I would expect Korea to start following the general trend. Also China has reduced less than others, I expect China will also move toward the trend shown by the others (from 2005 to 2010 they certainly did).
For the 10 largest manufacturing countries in 2010, the overall manufacturing GDP percentage was 24.9% of GDP in 1980 and dropped to 17.7% in 2010. The point often missed by those looking at their country is most of these countries are growing manufacturing, they are just growing the rest of their economy more rapidly. It isn’t accurate to see this as a decline of manufacturing. It is manufacturing growing more slowly than (information technology, health care, etc.).

This chart shows manufacturing output, as percent of GDP, by country and was created by the Curious Cat Economics Blog based on UN data. You may use the chart with attribution.
The manufacturing share of the USA economy dropped from 21% in 1980 to 18% in 1990, 15% in 2000 and 13% in 2010. Still, as previous posts show, the USA manufacturing output has grown substantially: over 300% since 1980, and 175% since 1990. The proportion of manufacturing output by the USA (for the top 10 manufacturers) has declined from 33% in 1980, 32% in 1990, 35% in 2000 to 26% in 2010. If you exclude China, the USA was 36% of the manufacturing output of these 10 countries in 1980 and 36% in 2010. China’s share grew from 7.5% to 27% during that period.
The United Kingdom has seen manufacturing fall all the way to 10% of GDP, manufacturing little more than they did 15 years ago. Japan is the only other country growing manufacturing so slowly (but Japan has one of the highest proportion of GDP from manufacturing – at 20%). Japan manufactures very well actually, the costs are very high and so they have challenges but they have continued to manufacture quite a bit, even if they are not growing output much.
Big Income Losses for Those Near Retirement takes a look at some interesting data, including data on median income drops due to the too-big-too-fail credit crisis recession.
The post also includes data showing the only groups with income increases as those 65-74 years old and, 75 and over which is surprising. 25-34 took the 2nd largest drop decreasing 8.9%.
Another interesting tidbit is the percent of people over 65 with jobs. In 1960 20% of those over 65 had jobs. Which pretty much decreased steadily to 10% in 1986 and then has increased steadily to 17% in 2011.
Related: USA Individual Earnings Levels: Top 1% $343,000, 5% $154,000, 10% $112,000, 25% $66,000 –
Looking at Data on the Value of Different College Degrees – 60% of Workers in the USA Have Less Than $25,000 in Retirement Savings – Credit Card Regulation Has Reduced Abuse By Banks
After several poor months for job creation (adding well under 100,000 each month) we have some good news. Total nonfarm payroll employment rose by 163,000 in July, with the unemployment rate at 8.3%. Since the beginning of this year, employment growth has averaged 151,000 per month, about the same as the average monthly gain of 153,000 in 2011.
The change in total nonfarm payroll employment for May was revised from +77,000 to +87,000, and the change for June was revised from +80,000 to +64,000. Which means the total job gains for this report is 157,000 (163,000 +10,000 [for May] and -16,000 [for June]).
One of the continuing severe problems (since the credit crisis bubble burst) has been long term unemployment. In July, the number of long-term unemployed (those jobless for 27 weeks and over) was 5.2 million. These individuals accounted for 40.7% of the unemployed (a high figure historically).
Given all the problems created by the financial system failure (created over the last 15 years – in the USA and Europe) it is actually fairly amazing that we have been adding jobs nearly as much as we have. But climbing out of the huge whole we created for ourselves (by continually re-electing those that allowed the too-big-too-fail financial mess – and those we elect continue to reward their friends that created the mess instead of fixing it) is a huge task. It requires much better job creation than we have had this year.
Adding 150,000 jobs a month would be decent if we hadn’t created such a huge problem that digging out of it requires much better results. Moving back above that average is much better than being below it, but we really need to bring the new jobs created above 200,000 for a couple years to make a serious dent in the problems created earlier.
Related: USA add 117,000 Jobs in July 2011 and Adjusts Previous Growth in May and June Up 56,000 More – USA Unemployment Rate at 9.6% (Sept 2010) – Unemployment Rate Drops Slightly to 9.4% (Aug 2009) –
Over 500,000 Jobs Disappeared in November 2008
Read more