There are many problems with the extremely low interest rates available in decade since the too-big-to-fail financial crisis. The interest rates seem to me to be artificially sustained by massive central bank actions for 12 years now.
Extraordinarily low rates encourage businesses to borrow money, after all how hard is it to invest in something that will return the business more than a few percent a year (that they can borrow at). Along with the continued efforts by the central banks to flood the economy with money any time there is even a slowdown in growth teaches companies to not worry about building a business that can survive bad times. Just borrow and if necessary borrow more if you are having trouble then just borrow more.
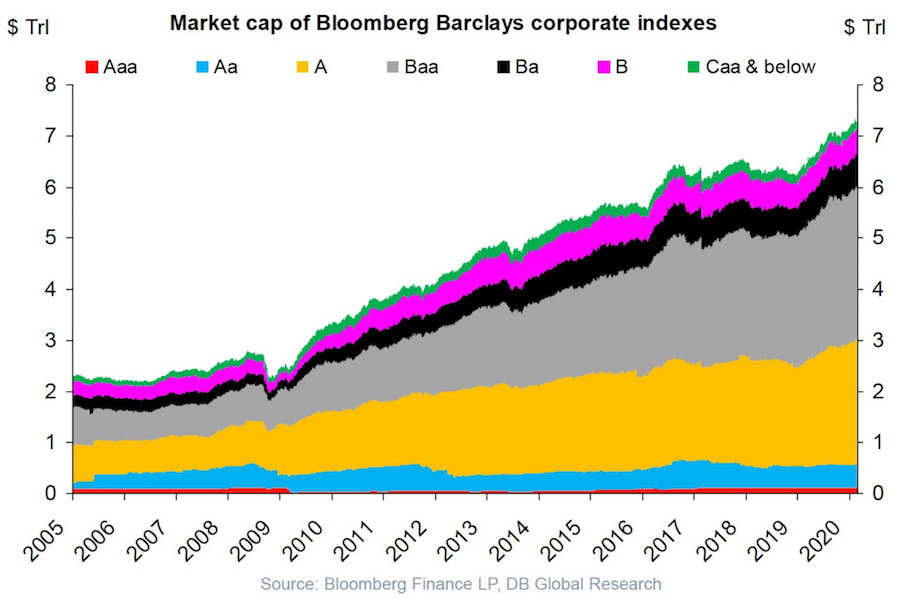
USA corporate debt has increased from a bit over $2 trillion in 2005 to over $7 trillion in 2020.
This isn’t a healthy way to build an economy. Businesses should be robust and able to sustain themselves if the economy experiences a recession and interest rates rise and the ability to borrow decreases.
Extremely low interest rates hide a huge potential cost if interest rates rise. Sure the huge debt is covered by cash flow in good times with the interest rate on your debt is 4%. What happens if interest rates rise to 6% and the economy declines? At some point investors (and banks) are going to realize that huge debt burdens on companies that are overly leveraged are not safe and deserve a premium interest rate.
I don’t think there is any risk to companies with very strong balance sheets and a business model that won’t have any trouble maintaining positive cash flow in a significant recession (Apple, Abbvie, Google, Costco, etc.). But many businesses are over-leveraged and at a significant risk of default in a bad economy.
The stock market is down quite a bit today partially due to the worry that the leveraged oil shale companies in the USA will go under if OPEC does not manage to restrict the supply of oil in order to keep oil prices high (or at least keep oil prices from collapsing).
Plenty of leveraged buyouts (where private equity firms take out cash and leave behind barely functional businesses) are barely able to survive even with extremely low interest rates. Those companies are in danger of failing when they experience even a small problems.
When 2 year US government bonds yield more than the 10 year US government bonds a recession is likely to appear soon. This chart shows why this is seen as such a reliable predictor.
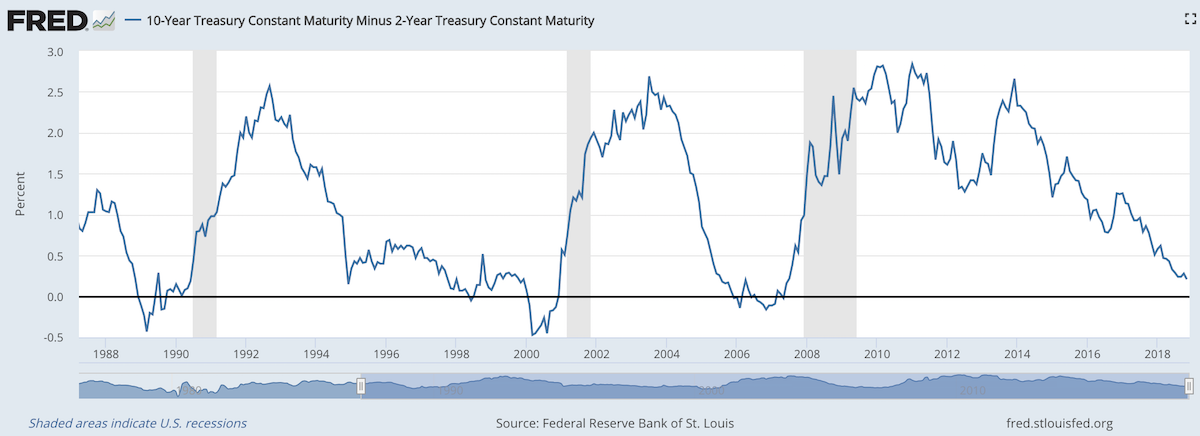
The chart shows the 10 year yield minus the 2 year yield. So when the value falls below 0 that means the 2 year yield is higher. Each time that happened, since 1988, a recession has followed (the grey shaded areas in the chart).
Do note that there were very small inversions in 1998 and 2006 that did not result in a recession in the near term. Also note that in every case the yield curve was no longer inverted by the time a recession actually started.
The reason why this phenomenon is getting so much attention recently is another thing that is apparent when looking at this chart, the 2 and 10 year yields are getting close to equal. But you can also see we are no closer than 1994 and the USA economy held off a recession for 7 more years.
Since 1970 the average length of time from the inversion of the 10 to 2 year yield curve has been 12 months (with a low of 6 months in 1973 and a high of 17 months, before the great recession of 2008).
In addition to a possibly impending yield curve inversion it has been a long time since the last recession which makes many investors and economists nervous that one may be due.
Related: 30 Year Fixed Mortgage Rates are not correlated with the Fed Funds Rate – Bond Yields Stay Very Low, Treasury Yields Drop Even More (2010) – Looking for Dividend Stocks in the Current Extremely Low Interest Rate Environment (2011) – Stock Market Capitalization by Country from 2000 to 2016
Another thing to note about yield curves at this time is that the US Federal Reserve continues to hold an enormous amount of long term government debt (trillions of dollars) which it has never done before the credit crisis of 2008. This reduces the long term yield since if they sold those assets that would add a huge amount of supply. How this impacts the predictive value of this measure will have to be seen. Also, one way for the Fed to delay the inversion would be to sell some of those bonds and drive up long term rates.
The Federal Reserve Bank of New York’s Center for Microeconomic Data today issued its Quarterly Report on Household Debt and Credit, which reported that total household debt increased by $193 billion (1.5%) to $13.15 trillion in the fourth quarter of 2017. This report marks the fifth consecutive year of positive annual household debt growth. There were increases in mortgage, student, auto, and credit card debt (increasing by 1.6%, 1.5%, 0.7% and 3.2% respectively) and another modest decline in home equity line of credit (HELOC) balances (decreasing by 0.9%).
Outstanding consumer debt balances by type: $8.88 trillion (mortgage), $1.38 trillion (student loans), $1.22 trillion (auto), $834 billion (credit card), $444 (HELOC).
Mortgages are the largest form of household debt and their increase of $139 billion was the most substantial increase seen in several quarters. Unlike overall debt balances, which last year surpassed their previous peak reached in the third quarter of 2008, mortgage balances remain 4.4% below it. The New York Fed issued an accompanying blog post to examine the regional differences in mortgage debt growth since the previous peak.

As of December 31, 4.7% of outstanding debt was in some stage of delinquency. As the chart shows mortgage and credit card debt delinquency rates have decreased sharply since 2010. Student loan debt delinquency rates have increased substantially during the same period (and delinquency rates for student loans are likely to understate effective delinquency rates because about half of these loans are currently in deferment, in grace periods or in forbearance and therefore temporarily not in the repayment cycle. This implies that among loans in the repayment cycle delinquency rates are roughly twice as high). You can understand why many see student debt as a huge economic problem the economy is facing in the coming years.
Of the $619 billion of debt that is delinquent, $406 billion is seriously delinquent (at least 90 days late or “severely derogatory”). The flow into 90+ days delinquency for credit card balances has been increasing notably from the last year and the flow into 90+ days delinquency for auto loan balances has been slowly increasing since 2012.
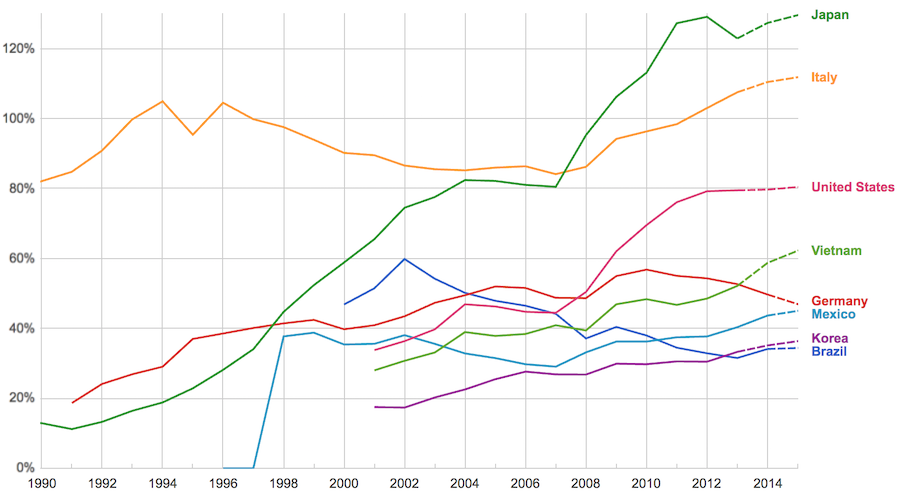
The data, from IMF, does not include China or India.
The chart shows data for net debt (gross debt reduced by certain assets: gold, currency deposits, debt securities etc.).
Viewing our post on the data in 2014 we can see that the USA improved on the expectations, managing to hold net debt to 80% instead of increasing to 88% as expected. Nearly every country managed to take on less debt than predicted (Vietnam took on more, but is very low so this is not a problem).
Taking on debt to invest in valuable resources (building roads, mass transit, internet infrastructure, education, environmental regulation and enforcement, health care, renewable energy…) that will boost long term economic performance can be very useful. The tricky part is knowing the debt levels doesn’t tell you whether the debt was taken on for investment or just to let current taxpayers send the bills for their consumption to their grandchildren.
Also government debt can become a huge burden on the economy (especially if the debt is owed outside the country). The general consensus today seems to be that 100% net debt level is the maximum safe amount and increasing beyond that gets riskier and riskier.
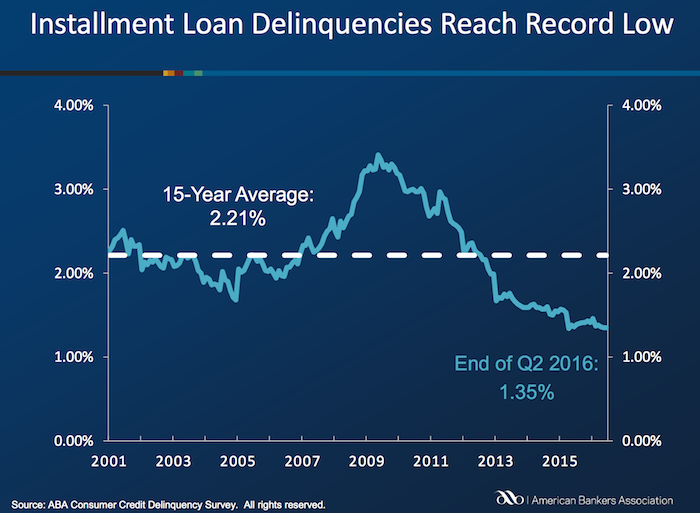
Delinquencies in closed-end loans fell slightly in the second quarter, driven by a drop in home equity loan delinquencies, according to results from the American Bankers Association’s Consumer Credit Delinquency Bulletin.
The composite ratio, which tracks delinquencies in eight closed-end installment loan categories, fell 3 basis points to 1.35% of all accounts – a record low. This also marked the third year that delinquency rates were below the 15-year average of 2.21%. The ABA report defines a delinquency as a late payment that is 30 days or more overdue. This is good news but the personal financial health of consumers in the USA is still in need of significantly improvements to their balance sheets. Debt levels are still too high. Savings levels are still far to low.
Home equity loan delinquencies fell 4 basis points to 2.70% of all accounts, which helped drive the composite ratio down. Other home related delinquencies increased slightly, with home equity line delinquencies rising 6 basis points to 1.21% of all accounts and property improvement loan delinquencies rising 2 basis points to 0.91% of all accounts. Home equity loan delinquencies dipped further below their 15-year average of 2.85%, while home equity line delinquencies remained just above their 15-year average of 1.15 percent.
Bank card delinquencies edged up 1 basis point to 2.48% of all accounts in the second quarter. They remain significantly below their 15-year average of 3.70 percent.
The second quarter 2016 composite ratio is made up of the following eight closed-end loans. All figures are seasonally adjusted based upon the number of accounts.
Closed-end loans
Home equity loan delinquencies fell from 2.74% to 2.70%.
Mobile home delinquencies fell from 3.41% to 3.17%.
Personal loan delinquencies fell from 1.44% to 1.43%.
Direct auto loan delinquencies rose from 0.81% to 0.82%.
Indirect auto loan delinquencies rose from 1.45% to 1.56%.
Marine loan delinquencies rose from 1.03% to 1.23%.
Property improvement loan delinquencies rose from 0.89% to 0.91%.
RV loan delinquencies rose from 0.92% to 0.96%.
Open-end loans
Bank card delinquencies rose from 2.47% to 2.48%.
Home equity lines of credit delinquencies rose from 1.15% to 1.21%.
Non-card revolving loan delinquencies rose from 1.57% to 1.65%.
Related: Debt Collection Increasing Given Large Personal Debt Levels (2014) – Consumer and Real Estate Loan Delinquency Rates from 2001 to 2011 in the USA – Good News: Credit Card Delinquencies at 17 Year Low (2011) – Real Estate and Consumer Loan Delinquency Rates 1998-2009 – The USA Economy Needs to Reduce Personal and Government Debt (2009)
This is a continuation of my previous post: Investing in Peer to Peer Loans
LendingClub suggest a minimum of 100 loans (of equal size) to escape the risk of your luck with individual loans causing very bad results. Based on this diversity the odds of avoiding a loss have been very good (though that obviously isn’t a guarantee of future performance), quote from their website (Nov 2015):
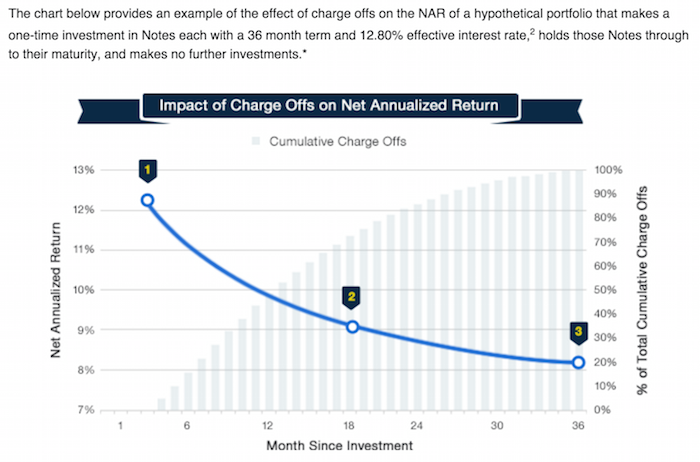
This chart, from LendingClub, shows a theoretical (not based on past performance) result. The basic idea is that as the portfolio ages, more loans will default and thus the portfolio return will decline. This contrasts with other investments (such as stocks) that will show fluctuating returns going up and down (over somewhat dramatically) over time.
For portfolios of personal loans diversity is very important to avoid the risk of getting a few loans that default destroying your portfolio return. For portfolios with fewer than 100 notes the negative returns are expected in 12.8% of the cases (obviously this is a factor of the total loans – with 99 loans it would be much less likely to be negative, with 5 it would be much more likely). I would say targeting at least 250 loans with none over .5% would be better than aiming at just 100 loans with none over 1% of portfolio.
There are several very useful sites that examine the past results of Lending Club loans and provide some suggestions for good filters to use in selecting loans. Good filters really amount to finding cases where Lending Club doesn’t do the greatest job of underwriting. So for example many say exclude loans from California to increase your portfolio return. While this may well be due to California loans being riskier really underwriting should take care of that by balancing out the risk v. return (so charging higher rates and/or being more stringent about taking such loans.
So I would expect Lending Club to adjust underwriting to take these results into account and thus make the filters go out of date. Of course this over simplifies things quite a bit. But the basic idea is that much of the value of filters is to take advantage of underwriting weaknesses.

This chart (for 36 month loans) is an extremely important one for investors in peer to peer loans. It shows the returns over the life of portfolios as the portfolio ages. And this chart (for LendingClub) shows the results for portfolios of loans issued each year. This is a critical tool to help keep track to see if underwriting quality is slipping.
Peer to peer lending has grown dramatically the last few years in the USA. The largest platforms are Lending Club (you get a $25 bonus if you sign up with this link – I don’t think I get anything?) and Prosper. I finally tried out Lending Club starting about 6 months ago. The idea is very simple, you buy fractional portions of personal loans. The loans are largely to consolidate debts and also for things such as a home improvement, major purchase, health care, etc.).
With each loan you may lend as little as $25. Lending Club (and Prosper) deal with all the underwriting, collecting payments etc.. Lending Club takes 1% of payments as a fee charged to the lenders (they also take fees from the borrowers).
Borrowers can make prepayments without penalty. Lending Club waives the 1% fee on prepayments made in the first year. This may seem a minor point, and it is really, but a bit less minor than I would have guessed. I have had 2% of loans prepaid with only an average of 3 months holding time so far – much higher than I would have guessed.
On each loan you receive the payments (less a 1% fee to Lending Club) as they are made each month. Those payments include principle and interest.

This chart shows the historical performance by grade for all issued loans that were issued 18 months or more before the last day of the most recently completed quarter. Adjusted Net Annualized Return (“Adjusted NAR”) is a cumulative, annualized measure of the return on all of the money invested in loans over the life of those loans, with an adjustment for estimated future losses. From LendingClub web site Nov 2015, see their site for updated data.
Lending Club provides you a calculated interest rate based on your actual portfolio. This is nice but it is a bit overstated in that they calculate the rate based only on invested funds. So funds that are not allocated to a loan (while they earn no interest) are not factored in to your return (though they actually reduce your return). And even once funds are allocated the actual loan can take quite some time to be issued. Some are issued within a day but also I have had many take weeks to issue (and some will fail to issue after weeks of sitting idle). I wouldn’t be surprised if Lending Club doesn’t start considering funds invested until the loan is issued (which again would inflate your reported return compared to a real return), but I am not sure how Lending Club factors it in.
My comments on a post by Kiva about their decision to end the Kiva Zip (direct to people loans – no intermediary financial institution) program in Kenya.
I do think it is very important to retain an infrastructure for those people you got to try the new effort with, as I believe Kiva will. This has to be part of any innovation efforts – a budget to include unwinding the effort in a way that is in keeping with Kiva’s mission to help people. I strongly believe in efforts to avoid abandoning those who worked with you in general, but for those taking loans from Kiva it is much more important than normal.
Keep up the good work. And keep challenging Kiva to get better and not get complacent when things are not going as well as they should. I am happy to continue to lend to Kiva but I also am concerned that the focus on making a difference and making people’s lives better can be lost in the desire to grow.

I made a loan via Kiva zip for Hilda to buy a posho mill machine. The loan was repaid in full.
The Curious Cats group on Kiva has made over $27,000 in loans to entrepreneurs around the world (the way Kiva works the groups, they don’t include Kiva Zip loans). You can join us. I believe in the model of micro-finance (Investing in the Poorest of the Poor [this one is grants instead of loans]), though I also believe we need more data on real experience of borrowers. Kiva Zip gives loans directly to people with a 0% interest rate. Normal Kiva loans have financial institutions (some of which are charities but they still have expenses) make the loans and Kiva lenders provide capital (at 0%) but the borrowers have to pay interest (the idea is they pay lower interest since the financial institution has a 0% cost of capital).
Related: Kiva Loans to Entrepreneurs in Columbia, India and Kenya – Kiva Loans Give Entrepreneurs a Chance to Succeed (2011) – Using Capitalism to Create Better Lives in Mali (2009)
My response to a comment by John Green on Reddit
I really really like your work and webcasts (example included below).
This seems to me to make it really difficult on people trying to use judgement. Calling people’s actions “extremely paternalistic” if they are not definitely so, I think impedes debate. And I think debate should be encouraged.
When making Kiva loans I do steer away from loans with rates above 40% (I also prefer loans that are geared toward a capital investment that will increase earning power going forward though this is hard – lots of loans are essentially for inventory that will be sold at a profit so a fine use of loans but not as powerful [in my opinion] and new capital investments – say a new tool, solar power that will be resold to users…).
Just like people anywhere, people taking Kiva loans are capable of getting themselves into trouble. Choosing to allocate my lender toward certain loans does not mean I am being paternalistic.
I am not being paternalistic if I chose not to invest in the stock of some company that vastly overpays executives and uses high leverage to do very well (in good times).
I do like the idea of direct cash to people in need. I give cash that way (and in fact did it a long time ago, 20 years, for several years – before any of this new hipster cachet :-). And I still do like it.
Based on my thoughts on killing the Goose laying golden eggs in Iskandar Malaysia posted on a discussion forum. The government has instituted several several policies to counteract a bubble in luxury real estate prices in the region (new taxes on short term capital gains in real estate [declining amounts through year 6]), increasing limits on purchases by foreigners, new transaction fees (2% of purchase price?) for real estate transactions, requirements for larger down-payments from purchasers…
Iskandar is 5 times the size of Singapore and is in the state of Johor in Malaysia. Johor Bahru is the city which makes up much of Iskandar but as borders are currently drawn Iskandar extends beyond the borders of Johor Bahru.
The prospects for economic growth in Iskandar Malaysia in the next 5, 10 and 15 years remain very strong. They are stronger than they were 5 years ago: investments that produce economic activity (theme parks, factories, hospitals, hotels, retail, film studio…) have come online and more on being built right now.
Cooperation with Singapore is the main advantage Iskandar has (Iskandar is next to the island of Singapore similar to those areas surrounding Manhattan). It provides Iskandar world class advantages that few other locations have (it is the same advantages offered by lower cost areas extremely close to world class cities – NYC, Hong Kong, London, San Francisco etc.). Transportation connections to Singapore are critical and have not been managed as well as they should have been (only 2 bridges exist now and massive delays are common). A 3rd link should be in place today (they haven’t even approved the location yet).
A MRT connection to Singapore (Singapore’s subway system) should be a top priority of anyone with power interested in the future economic well being of Iskandar and Johor. Johor Bahru doesn’t have a light rail system yet this would be the start of it. It has been “announced” as planned for 2018 but not officially designated or funded yet.