Even though there are plenty of ways to improve the economic conditions for most people today is very good compared to similar people 50 years ago. There are a few, small population segments that there are arguments for being worse off, but these are a tiny percentage of the global population.
However, we humans often compare ourselves to whoever is better off than us and feel jealous. So instead of appreciating good roads, food, shelter, health care, etc. we see where things could be better (either our parents had it a bit better or these people I see on TV or in this other country, etc.). It is good to see how we could improve if we then take action to improve. To just be frustrated that others have it better doesn’t do any good, it doesn’t seem to me.
There are significant ways governments can help or hinder the economic well being of their citizens. I am a big believer in the power of capitalism to provide wealth to society. That isn’t the same as supporting the huge push to “crony capitalism” that many of the political parties throughout the world are promoting. The “capitalism” in that phrase exists for alliteration, the real meaning is the word crony.

street scene in Seoul, South Korea (photo by John Hunter)
These Are the World’s Most Innovative Economies
These type of rankings are far from accurate, what does most innovative really mean? But they do provide some insight and I think those at the top of the list do have practices worth examining. And I do believe those near the top of this list are doing a better job of providing for the economic future of their citizens than other countries. But the reality is much messier than a ranking illustrates.
With that in mind the ranking shows
- Korea
- Sweden
- Germany
- Switzerland
- Finland
- Singapore
- Japan
- Denmark
- USA
One thing that is obvious is the ranking is very biased toward already rich countries. When you look at the measures they use to rank it is easy to see this is a strong bias with their method.
China is 21st. Malaysia is 23rd and an interesting country doing very well compared to median income (I am just guessing without actually plotting data). Hong Kong is 35th, which is lower than I imagine most people would have predicted. Thailand is 44th. Brazil is 46th and even with their problems seems low. Brazil has a great deal of potential if they can take care of serious problems that their economy faces.
In a previous post I examined the GDP Growth Per Capita for Selected Countries from 1970 to 2010, Korea is the country that grew the most (not China, Japan, Singapore…).
Related: Leading Countries for Economic Freedom: Hong Kong, Singapore, New Zealand, Switzerland – Economic Consequences Flow from Failing to Follow Real Capitalist Model and Living Beyond Our Means – Easiest Countries in Which to Operate a Businesses (2011)

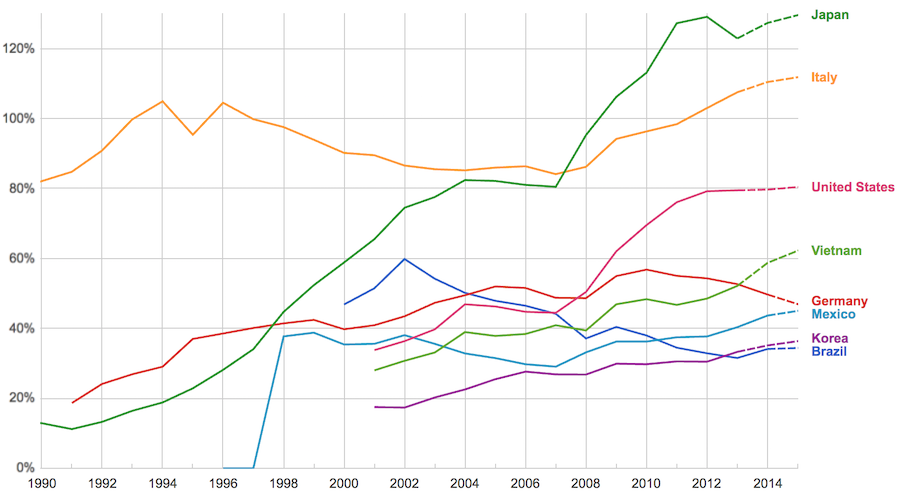
The data, from IMF, does not include China or India.
The chart shows data for net debt (gross debt reduced by certain assets: gold, currency deposits, debt securities etc.).
Viewing our post on the data in 2014 we can see that the USA improved on the expectations, managing to hold net debt to 80% instead of increasing to 88% as expected. Nearly every country managed to take on less debt than predicted (Vietnam took on more, but is very low so this is not a problem).
Taking on debt to invest in valuable resources (building roads, mass transit, internet infrastructure, education, environmental regulation and enforcement, health care, renewable energy…) that will boost long term economic performance can be very useful. The tricky part is knowing the debt levels doesn’t tell you whether the debt was taken on for investment or just to let current taxpayers send the bills for their consumption to their grandchildren.
Also government debt can become a huge burden on the economy (especially if the debt is owed outside the country). The general consensus today seems to be that 100% net debt level is the maximum safe amount and increasing beyond that gets riskier and riskier.
The most popular posts on the Curious Cat Investing and Economics blog in 2016 (by page views).
- Top 10 Countries for Manufacturing Production in 2010: China, USA, Japan, Germany… (posted in 2011)
- Manufacturing Output as a Percent of GDP by Country (1980 to 2008) (2010)
- Default Rates on Loans by Credit Score (2015)*
- Stock Market Capitalization by Country from 1990 to 2010 (2012)
- Investing in Peer to Peer Loans (2015)
- Manufacturing Output by Country 1999-2011: China, USA, Japan, Germany (2013)
- The 20 Most Valuable Companies in the World – October 2015
- Manufacturing Output as Percent of GDP from 1980 to 2010 by Country (2012)
- Monopolies and Oligopolies do not a Free Market Make (2008)
- Government Debt as Percentage of GDP 1990-2009: USA, Japan, Germany, China… (2010)
- USA Individual Earnings Levels: Top 1% $343,000, 5% $154,000, 10% $112,000, 25% $66,000 (2012)

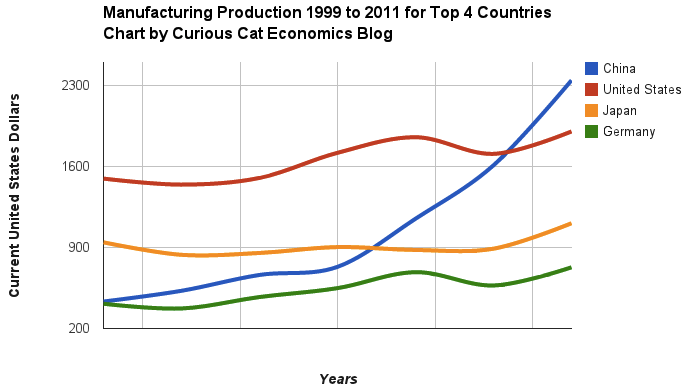
Chart of manufacturing production by China, USA, Japan and Germany from 1999 to 2011. The chart was created by the Curious Cat Economics Blog using UN data. You may use the chart with attribution. All data is shown in current USD (United States Dollar).