The most popular posts on the Curious Cat Investing and Economics blog in 2018 (based on page views).
- Default Rates on Loans by Credit Score (2015)
- Stock Market Capitalization by Country from 2000 to 2016 (2017)
- Stock Market Capitalization by Country from 1990 to 2010 (2012)
- The 20 Most Valuable Companies in the World – November 2017
- USA Household Debt Jumps to Record $13.15 Trillion (2018)*
- Save What You Can, Increase Savings as You Can Do So (2012)*
- Top 10 Countries for Manufacturing Production in 2010: China, USA, Japan, Germany… (posted in 2011)
- Government Debt as Percentage of GDP 1990-2009: USA, Japan, Germany, China… (2010)
- Manufacturing Output as a Percent of GDP by Country (1980 to 2008) (2010)
- “Explaining” Random Variation in Financial Data (2018)*
- Monopolies and Oligopolies do not a Free Market Make (2008)
- Factfulness – An Extremely Valuable Book (2018)*
- 10 Stocks for 10 Years (2018 version) *
- Health Savings Accounts in the USA, a spectacular personal finance option (2018)*
- Long Term Changes in Underlying Stock Market Valuation (2017)
- The USA Doesn’t Understand that the 1950s and 1960s are Not a Reasonable Basis for Setting Expectations (2011)
- We Need to Start Electing People That Fix Problems Instead of Watching Things Burn (2017)*
- Looking at GDP Growth Per Capita for Selected Countries from 1970 to 2010 (2011)*
- Buybacks, Giveaways to Executives and Non-GAAP Earnings (2016)
- USA Health Care Spending 2013: $2.9 trillion $9,255 per person and 17.4% of GDP (2015)
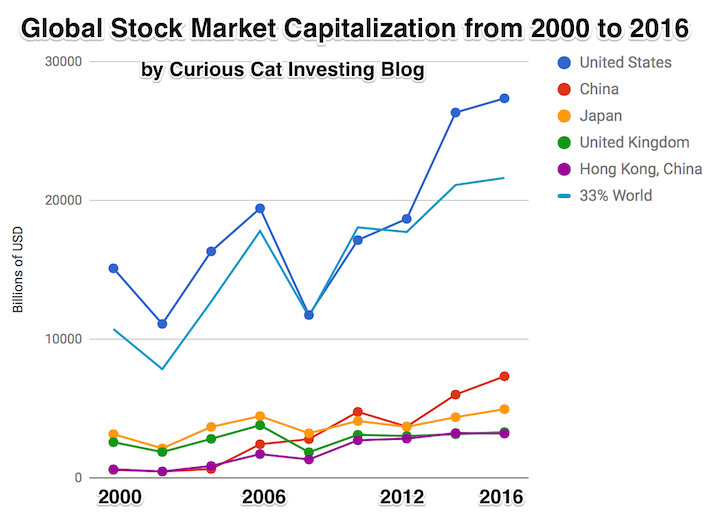
The chart shows the top countries based on stock market capitalization, with data from 2000 to 2016. The chart was created by Curious Cat Investing and Economics Blog may be used with attribution. Data from the World Bank.
* 8 posts appears this year that didn’t appear in the top 20 last year; 1 was first published in 2011, 1 in 2012, 1 in 2017 and 5 in 2018.
As with my other blogs, the most popular posts show that old posts stay popular for a long time. This blog is actually the blog with the most recency bias. Even so, 8 or the top 20 are more than 5 year old. Number of top 20 posts by year of publication:
2018: 5
2017: 4
2016: 1
2015: 2
2012: 2
2011: 3
2010: 2
2008: 1
Related: 20 Most Popular Posts on the Curious Cat Investing and Economics Blog in 2017 – The 20 Most Popular Post on the Curious Cat Science and Engineering Blog in 2018 – 20 Most Popular Posts on the Curious Cat Investing and Economics Blog in 2016 – 20 Most Popular Posts on the Curious Cat Investing and Economics Blog in 2014