A new study, Secure Retirement, New Expectations, New Rewards: Work in Retirement for Middle Income Boomers, explores how Boomers are blurring the lines between working for pay and retirement (as I have discussed in posts previously, phased retirement).
From their report:
The define middle income as income between $25,000 and $100,000 with less than $1 million in investable assets and boomers as those born between 1946 and 1964.
Nearly 70% of retirees retired earlier than they planned to. Many did so due to health issues. Only 3% retired so they could travel more.
48% of middle income boomer retirees wish they could work. For those wishing to, but unable to work: 73% cannot due to health, 17% can’t find a job and 10% must care for a loved one.
Nearly all (94%) nonretirees who plan to work in retirement would like some kind of special work arrangement, such as flex-time or telecommuting, but only about one third (37%) of currently employed retirees have such an arrangement.
It seems to me, both employees and employers need to be more willing to adapt. Workers seem to be more willing, even though they claim they are not: this is mainly a revealed versus stated preference, they claim they won’t accept lower pay but as all those that do show, they really are willing to do so, they just prefer not to. This report is based on survey data which always has issue; nevertheless there are interesting results to consider.
61% of middle income boomers who ware working say they do so because they want to work, not because they have to work.
Only 12% of working middle income boomer retirees work full time all year. 60% work part-time. 7% are seasonal while 16% are freelance and 4% are other. Of those identifying as non-retired 75% work full time while 17% are part-time.
49% plan to work into their 70’s or until their health fails.
51% are more satisfied with their post-retirement work than their pre-retirement work. 27% are equally satisfied with their jobs.
As I have stated in previous posts I think a phased approach to retirement is the most sensible thing for society and for us as individuals. Employers need to provide workable options with part time work. The continued health care mess in the USA makes this more of a challenge than it should be. With USA health care being closely tied to employment and it costing twice as much as other rich countries (for no better results) it complicates finding workable solutions to employment. The tiny steps taken in the Affordable Care Act are not even 10% of magnitude of changes needed for the USA health care system.
Related: Providing ways for those in their 60’s and 70’s (part time schedules etc.) – Companies Keeping Older Workers as Economy Slows (2009) – Keeping Older Workers Employed (2007) – Retirement, Working Longer to Make Ends Meet
One thing for investors consulting historical data to remember is we may have had fundamental changes in stock valuations over the decades (and I suspect they have). Just to over simplify the idea if lets say the market valued the average stock at a PE of 11 and everyone found stocks a wonderful investment. And so more and more people buy stocks and with everyone finding stocks wonderful they keep buying and after awhile the market is valuing the average stock at a PE of 14.
Within the market there is tons of variation those things of course are not nearly that simple, but the idea I think holds. Well if you look back at historical data the returns will include the adjustment of going from a PE of 11 to a PE of 14. Now maybe the new few decades would adjust from PE of 14 to PE of 17 but maybe not. At some point that fundamental re-adjustment will stop.
And therefore future returns would be expected to be lower than historically due to this one factor. Now maybe other factors will increase returns to compensate but if not the historical returns may well provide an overly optimistic view.
And if there is a short term bubble that lets say pushes the PR to 16 while the “fair” long term value is 14, then there will be a negative impact on the returns going forward bringing the PE from 16 to 14. That isn’t necessarily a drop (though it could be) in stock prices, it could just be very slow increases as earning growth slowly pushes PE back to 14.

Monument to the People’s Heroes with the Shanghai skyline in the background. See more photos by John Hunter
Another thing to consider is another long term macro-economic factor may also be giving long term historical returns an extra boost. The type of economic growth from the end of World War I to 1973 (just to pick a specific time, there was a big economic slowdown after OPEC drastically increased the price of oil). While that period includes the great depression and World War II, which massively distorts figures, from the end of WW I through the 1960s Europe and the USA went through an amazing amount of economic growth.
I am largely a fundamental investor with the long term time horizon that fits such investing. I however am also a believer in using some more speculative investing for a portion of a portfolio if it fits the risk profile of an investor.
If you are not comfortable with the risk of an investment most of the time you shouldn’t make that investment. There is a bit of a conflict, for example, where an investor is scared of any loss from say an investment in a stock market index and trying to save for retirement on a median level income. It is nearly impossible to save for retirement without investing in stocks if you are not already rich, so as with most investment advice there is a bit of difficulty at the extremes but in general investors shouldn’t take on risk they are not comfortable with.
For experienced investors with a high level of financial literacy more speculative options can have a useful role in a portfolio. Though you should realize most people fail with speculation, so you have to be realistic about your prospects. I have used speculative investments including naked short selling, leverage (margin) and options.
Spread betting is another speculative strategy that can play a part in an investment portfolio. Spread betting is not allowed in the USA (with our highly regulated personal investing environment but is available in most other countries). They are somewhat similar to binary options (which are allowed in the USA) and to futures contracts (they are not the same, just those are comparable to get some idea of how you would use them in a portfolio).
Spread betting really is a bet on what will happen. You don’t buy a financial instrument. You place a bet with a company and if the prices move for you and you close the position with a gain they pay out a gain to you and if you close out the position with a loss your capital held with them is reduced by your loss amount.
Since the price to control a position is much less than the notional position size there is a large degree of leverage which increases the affect of gains and loses. Since positions can move against you and must be settled if the loss exceed your deposit with the company you are trading with having a substantial cash cushion is the way I would use such a speculative account. If I decided I could afford to risk losing $5,000 I would deposit that amount.
My purchases would about 10% of the capital in the account (so $500 at first). If that is leveraged at 20 to 1 (just requiring 5% down on margin), that would make my effective leverage just 2 to 1. But if I added other positions that would increase my leverage, say 2 more purchases and my leverage would be 6 to 1.
The way I have managed the speculative portion of my portfolio is to fund it and then pull off part of the gains to my long term portfolio and retain part of the gains to build my speculative account. It isn’t really quite that clear as I have different level of speculation in my portfolio. Options are speculative but have a limit of 100% loss. Selling stocks short (naked shorting) is speculative but has theoretically unlimited losses. Using margin on regular stocks has the potential to lose more than you have invested though most of the time you should be stopped out before the losses are too much beyond your entire account value.
So I don’t really have a clear cut speculative portfolio but I roughly follow that procedure. I have added to the speculative portion when I have had very large gains in a particular portion of my main portfolio.
Another factor with spread betting, shorting and options is that they can actually be used to reduce the risk of your overall portfolio using certain strategies. If you believe there is a risk for a market downturn but don’t want to sell any of your stock holdings you can use spread betting to create a position that will gain if the market declines. That gain then will offset the likely loss on your stock positions thus reducing you risk in a market decline.
Of course, if you do that and the market moves up you will create a loss on you spread betting position that offsets your gains on your stock positions. You could also bet against specific stocks that you think will decline more in a market decline and seek to increase your return of course that has risks (including the market declining along with your stocks but that stocks you bet against could move against you anyway). I have used this strategy with selling stocks short occasionally.
An additional risk to consider with spread betting is you need to find a company you trust to be around to pay off your gains. You would want to examine the safety of your funds and that (in the UK) the account is covered by the Financial Conduct Authority (FCA) and complies with the FCA’s Client Assets provisions (and in other countries they have similar coverage). To be safe you should consider whether holding more than the covered amount is wise in your account. The last 10 years have provided examples of the riskiness of financial companies going out of business; that your funds wouldn’t be accessible is a risk that must be considered.
Related: Shorting Using Inverse Funds – Books on Trading and Speculating in Financial Markets – Selling Covered Call Options
Most popular posts on the Curious Cat Investing and Economics blog in 2014 (by page views).
- Top 10 Countries for Manufacturing Production in 2010: China, USA, Japan, Germany… (posted in 2011)
- Manufacturing Output as Percent of GDP from 1980 to 2010 by Country (2012)
- Government Debt as Percentage of GDP 1990-2009: USA, Japan, Germany, China… (2010)
- Nuclear Power Generation by Country from 1985-2010 (2012)
- Manufacturing Output by Country 1999-2011: China, USA, Japan, Germany (2013)
- Monopolies and Oligopolies do not a Free Market Make (2008)
- USA Individual Earnings Levels: Top 1% $343,000, 5% $154,000, 10% $112,000, 25% $66,000 (2012)
- The 20 Most Valuable Companies in the World – Apple, Exxon, Microsoft, Google… (2014) (
- House of Cards – Mortgage Crisis Documentary (2009)
- Iskandar Malaysia Economic Development Zone
- Oil Consumption by Country 1990-2009 (2010)
- Stock Market Capitalization by Country from 1990 to 2010 (2012)
- Cockroach Portfolio (2014)
- Global Stock Market Capitalization from 2000 to 2012 (2013)
- 11 Stocks for 10 Years – November 2014 Update
- Oil Production by Country 1999-2009 (2011)
- Chart of Largest Petroleum Consuming Countries from 1980 to 2010 (2011)
- Delaying the Start of Social Security Payments Can Pay Off (2014)
- Chart of Global Wind Energy Capacity by Country 2005 to 2013 (2014)
- USA Health Expenditures Reached $2.8 trillion in 2012: $8,915 per person and 17.2% of GDP (2014)
Related: 20 Most Popular Post on Curious Cat Science and Engineering Blog in 2014 – 10 Most Popular Posts on the Curious Cat Management Blog in 2014 – Most Popular Posts on the Curious Cat Management Comments Blog –
The Center for Retirement Research at Boston College is a tremendous resource for those planning for, or in, retirement. The center created the National Retirement Risk Index (NRRI) to capture a macroeconomic level measure of how those in the USA are progressing toward retirement.
Based on the Federal Reserve’s 2013 Survey of Consumer Finances the Center updated the NRRI results (the entire article is a very good read).
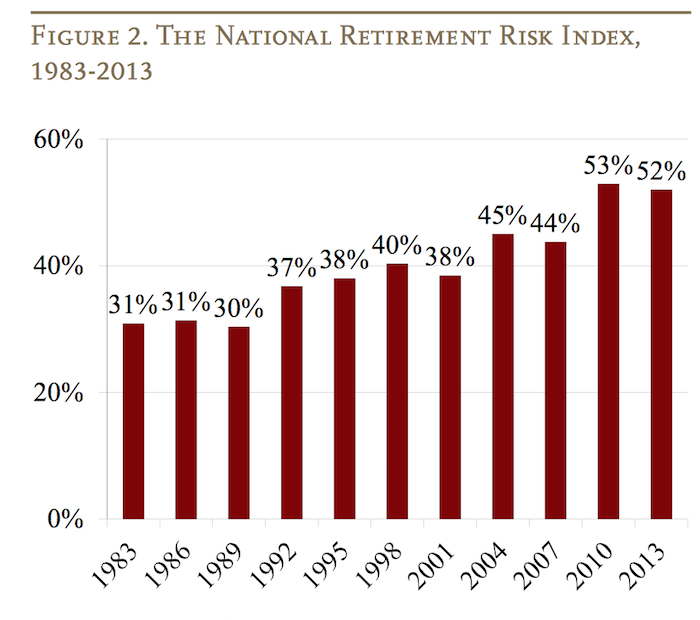
from the NRRI report.
The lower the risk number in the chart the better, so things have not been going well since the 1990s for those in the USA saving for retirement.
As the report discusses their are significant issues with retirement planning that defy easy prediction; this makes things even more challenging for those saving for retirement. The report discusses the difficulty placed on retirees by the Fed’s extremely low interest rate policy (a policy that provides billions each year to too-big-too-fail banks – hardly the reward that should be provided for bringing the world to economic calamity but never-the-less that transfer of wealth from retirees to too-big-to-fail banks is the policy the Fed has chosen).
That exacerbates the problems of too little savings during the working career for those in the USA. The continued evidence is that those in the USA continue to spend too much today and save too little. Also you have to expect the Fed and politicians will continue to make policy that favors their friends at too-big-fail banks and hedge funds and the like. You can’t expect them to behave differently than they have been the last 50 years. That means the likely actions by the government to take from median income people to aid the richest 1% (such as bailing out the bankers with super low interest rate policies and continue to subsidize losses and privatize their winning bets) will continue. You need to have extra savings to support those policies. Of course we could change to do things differently but there is no realistic evidence of any move to do so. Retirement planning needs to be based on evidence, not hopes about how things should be.
Related: How Much of Current Income to Save for Retirement – Save What You Can, Increase Savings as You Can Do So – Don’t Expect to Spend Over 4% of Your Retirement Investment Assets Annually – Retirement Planning: Looking at Assets (2012) – How Much Will I Need to Save for Retirement? (2009)
A reasonable amount of government debt is not a problem in a strong economy. If countries take on debt wisely and grow their economy paying the interest on that debt isn’t a problem. But as that debt grows as a portion of GDP risks grow.
Debt borrowed in other currencies is extremely risky, for substantial amounts. When things go bad they snowball. So if your economy suffers, your currency often suffers and then the repayment terms drastically become more difficult (you have to pay back the debt with your lower valued currency). And the economy was already suffering which is why the currency decreased and this makes it worse and they feed on each other and defaults have resulted in small economies over and over from this pattern.
If a government borrows in their currency they can always pay it back as the government can just print money. They may pay back money not worth very much but they can pay it back. Of course investors see this risk and depending on your economy and history demand high interest to compensate for this risk (of being paid back worthless currency). And so countries are tempted to borrow in another currency where rates are often much lower.
If you owe debts to other countries you have to pay that money outside the system. So it takes a certain percentage of production (GDP) and pays the benefit of that production to people in other countries. This is what has been going on in the USA for a long time (paying benefits to those holding our debt). Ironically the economic mess created by central banks and too-big-to-fail banks has resulted in a super low interest rate environment which is lousy for lenders and great for debtors (of which the USA and Japanese government are likely the 2 largest in the world).
The benefits to the USA and Japan government of super low interest rates is huge. It makes tolerating huge debt loads much easier. When interest rates rise it is going to create great problems for their economies if they haven’t grown their economies enough to reduce the debt to GDP levels (the USA is doing much better in this regard than Japan).
Japan has a much bigger debt problem than the USA in percentage terms. Nearly all their debt is owed to those in Japan so when it is paid it merely redistributes wealth (rather than losing it to those overseas). It is much better to redistribute wealth within your country than lose it to others (you can always change the laws to redistribute it again, if needed, as long as it is within your economy).
Insurance can be annoying as you pay for something you hope not to use. I don’t recall ever getting a payment on life insurance, homeowners insurance, disability insurance or auto insurance. And that I haven’t had a claim is good. On health insurance I have had minor things covered like a physical or dentist and that is it.
Health insurance is critical in the USA. One insurance that people often don’t think of however is disability insurance. Disability insurance is a very important insurance that too many people don’t consider (many jobs offer it, though not all, and some may take a year before you are covered). Studies show that a 20 year old has a 30% chance of becoming disabled before reaching retirement age. In the USA, the Social Security Administration provides disability benefits for total disabilities.
In the USA you may be eligible for social security disability payments but it is a small amount (so not sufficient by itself). But if you are living overseas and not paying social security I am not sure if you are covered, even for the limited coverage it provides.
I am not sure what the situation is for citizens of other countries, maybe they have better safety nets for people (I would imagine Europe does, but many places probably don’t).
I had been living in Malaysia for several years and am now going nomadic (an increasingly popular choice for a small but determined group of people) and insurance is important for people living overseas and traveling. For nomads or frequent travelers global health insurance is good (though usually it will exclude the USA if you are not a “USA 1%er”(or world .2%)/very-rich as the extremely broken USA health care system is crazy – you can be covered globally excluding the USA for about 1/6 of that same coverage excluding the USA, depending, of course on your coverage). Special care for travelers and nomads should be paid to coverage to return you home if you are very sick or injured.
Disability insurance is something thing digital nomads should pay attention to. But it is normally ignored. And it is a bit tricky as insurance companies are generally extremely slow to catch up to what the world is doing and disability insurance seems to be stuck in the old notions about how tied people were to one country (as are other things – demanding physical addresses even if they know you are nomadic…, basing rules on silly ideas about where you happen to be at some point in time with customer hostile breaking of internet services that have been paid for etc.).
Related: Personal Finance Basics: Long Term Disability Insurance – The Growing Market for International Travel for Medical Care – Long Term Care Insurance: Financially Wise but Current Options are Less Than Ideal
My response to a comment by John Green on Reddit
I really really like your work and webcasts (example included below).
This seems to me to make it really difficult on people trying to use judgement. Calling people’s actions “extremely paternalistic” if they are not definitely so, I think impedes debate. And I think debate should be encouraged.
When making Kiva loans I do steer away from loans with rates above 40% (I also prefer loans that are geared toward a capital investment that will increase earning power going forward though this is hard – lots of loans are essentially for inventory that will be sold at a profit so a fine use of loans but not as powerful [in my opinion] and new capital investments – say a new tool, solar power that will be resold to users…).
Just like people anywhere, people taking Kiva loans are capable of getting themselves into trouble. Choosing to allocate my lender toward certain loans does not mean I am being paternalistic.
I am not being paternalistic if I chose not to invest in the stock of some company that vastly overpays executives and uses high leverage to do very well (in good times).
I do like the idea of direct cash to people in need. I give cash that way (and in fact did it a long time ago, 20 years, for several years – before any of this new hipster cachet :-). And I still do like it.
While people question the value of a college degree a recent study by the New York Federal Reserve shows a degree is close to as valuable today as it has ever been. The costs to get that value have risen but even with the increased cost students earn on average a 15% annual rate of return on their investment.
Of course, not every student will earn that, some will earn more and some less.
…
The time required to recoup the costs of a bachelor’s degree has fallen substantially over time, from more than twenty years in the late 1970s and early 1980s to about ten years in 2013. So despite the challenges facing today’s college graduates, the value of a college degree has remained near its all-time high, while the time required to recoup the costs of the degree has remained near its all-time low.

So a college education is a great investment for most people. This can create a problem however, when people then assume that all they need to do is go to college and they will do well no matter what. The same thing happens in other markets. Real estate has proven to be a great investment. that doesn’t mean every real estate investment is good. It doesn’t mean you can ignore the costs and risks of a particular investment. The same goes for stocks.
One of the things that annoy me as an investor is how happy the executives are to grant themselves huge amount of pay in general and stock in particular. The love to giveaway huge amounts of stock to themselves and their buddies and then pretend that isn’t a cost.
Thankfully the GAAP rules changed a few years ago to require making the costs of stock giveaways show up on official earnings statements. Now, the companies love to trumpet non-GAAP earnings that exclude stock based compensation to employees.
The stock based costs are huge.
SG Securities estimates that corporates bought back $480 billion in stock last year, and then reissued about $180 billion.
The theme of the article is that stock buybacks have declined drastically very recently. There has been a huge bubble recently fueled by the too-big-too-fail bailout (quantitative easing). But don’t expect the executives giving themselves tons of stock to decline.
Accounting isn’t as straight forward as people who have never looked at it would like to think. While giving away stock is definately a cost, it isn’t a cash cost. The cash flow statement is best for looking at cash anyway. And the better your company does the more the free spirited giveaway of stock costs (both in your reduced share of the well performing company and the higher cost to buy back the shares they gave away).
They have excuses that they hire people who are not motivated enough to do their job for their pay so they need to offer stock options as a extra payment. But the main reason they like it is they can pretend that the pay to employees isn’t costing as much as it is because we gave them stock options not cash. As if paying $1 billion in cash is somehow more costly than giving away options and then spending $1 billion on buybacks of the stock they gave away.
Options make a lot of sense for small private companies. In a very limited way they can make sense as companies grow. But the practices of executives in huge bureaucracies giving away large amounts of your equity, on top of huge paychecks, is very harmful.
Related: Apple’s Outstanding Shares Increased from 848 to 939 million shares from 2006 to 2013 (while I think Apple’s large buyback is good, the huge share giveaways continue and are bad policy) – Google is Diluting Shareholder Equity by 1% a year (2009-2013) – Executives Again Treating Corporate Treasuries as Their Money