The $1.9 trillion covid19 relief law (American Rescue Plan Act) includes large increases in health insurance subsidies in addition to the $1,400 per person payments to individuals. The law increases subsidies for 2 years.
Under the new law, nobody will have to pay more than 8.5% of their income on health insurance. The government will also pick up 100% of COBRA premiums through September. COBRA is health insurance for people who’ve lost their jobs.
“Probably about three-quarters of uninsured people in the U.S. who are citizens are going to be eligible for some sort of financial help,” said Cynthia Cox, a vice president at the Kaiser Family Foundation.
I wrote before about the fact that under the old law, based on how the subsidy worked you could lose over $5,000 in health care subsidy payments by earning just enough to no longer be eligible for the subsidy. This new law eliminates that issue (for 2 years) as health insurance costs are now subsidized so that they cost no more than 8.5% of income (instead of having a hard cut off where subsidies go to $0).

For people most people that pay for their health care themselves (instead of their employer paying) this is likely a much larger benefit than the cash payment of $1,400.
The Kaiser Family Foundation calculator lets you get a quick idea of what your approximate subsidy benefit. A 55 year old earning $55,000 would be entitled to a subsidy of $4,700 about 50% of their health insurance costs (based on the USA average). For a 50 year old the subsidy would be $2,900 or 38%. For a 60 year old the subsidy would be $6,800 or 59%. For a couple of 35 year olds and 2 children the subsidy would be $12,100 per year or 72%.
For a 35 year old couple earning $85,000 with 2 children the subsidy would be $9,600 per year or 57%. And for a 55 year old earning $85,000 the the subsidy would be $2,200 per year or 23%.
Only the family of 4 would have been eligible for any subsidies under the old law (or will be eligible after this new law expires in 2 years). And the single 55 year old earning more than $80,000 is not eligible for the $1,400 payment but would receive $2,200 as a health care subsidy.
This is a huge personal finance benefit that has not been widely discussed but will have a huge impact on people’s financial health for the next 2 years.
In some ways investing recently has been pretty easy, anything you have bought (almost) goes up – and usually goes up a lot. But when looking for bargains to invest in, it just keeps getting more and more difficult in my opinion.
Apple’s most recent earnings report was spectacular. However, unlike when similar things happened 8 years ago, when such great news allowed you to buy a great company cheaply even after great news now Apple went from an already pricy level and added 10% to that the next day. And it has continued to go up. Apple is by far my largest holding (given how expensive it is, a fairly crazy 25%). So I do still like the company long term, but I have been selling a bit the last year (though not nearly enough to keep it from dominating my portfolio more and more).
Years ago it was easy for me to buy Apple and be very confident I would do very well over the next 5 to 10 years. Now I am more hopeful than confident. And one reason why I continue to hold so much is I don’t see other great buys.
In the last 6 months I did make a big buy of Sea Limited ($SE) a company based in Singapore with large gaming, internet commerce and emoney interests. They are especially focused on South East Asia. I bought a lot of this quickly and that has proved wise (at least so far). I made it my 3rd largest holding (Alphabet is 2nd) very quickly and I am up over 100% already. It is speculative. But given my options it seemed like a great opportunity. I would have been much slower to increase the size of this position if I had other options I really liked.
Overall I am going much more into cash as a safe haven than I have before. Normally I am extremely overweight stocks. Even today I am still overweight stocks compared to the conventional wisdom (and the only bonds I hold are Series I USA Savings Bonds (which are actually a good investment option, though you are limited to buying $10,000 per year).
While the markets are giving investors great returns finding good buys is becoming more and more difficult (at least for me). For example, my 10 Stocks for 10 Years (2018 version) has done very well. But several of those stocks are much less a bargain today that they were. Apple is up from $225 to $450. Danaher from $103 to $206. Amazon from $2,000 to $3,150. Tencent from $43 to $68. Alibaba from $175 to $256. The only stock down is Abbvie, from $97 to $95 (though with dividends, it yields 5% now, it is up a small bit). Abbive seems like the rare bargain to me today. While there are short term risks Tencent and Alibaba also seem to be priced reasonably and offer good long term potential.
I think, my post, Long Term Changes in Underlying Stock Market Valuation, provides insight into the challenges of consistently finding the type of values today than was possible in previous decades.
Related: Investment Options Are Much Less Comforting Than Normal These Days (2013) – Retirement Portfolio Allocation for 2020 – Tucows: Building 3 Businesses With Strong Positive Cash Flow
The markets continue to provide difficult options to investors. In the typical market conditions of the last 50 years I think a sensible portfolio allocation was not that challenging to pick. I would choose a bit more in stocks than bonds than the commonly accepted strategy. And I would choose to put a bit more overseas and in real estate.
But if that wasn’t done and even something like 60% stocks and 40% bonds were chosen it would seem reasonable (or 60% stocks 25% bonds and 15% money market – I really prefer a substantial cushion in cash in retirement). Retirement planning is fairly complex and many adjustments are wise for an individual’s particular situation (so keep in mind this post is meant to discuss general conditions today and not suggest what is right for any specific person).
I wrote about Retirement Savings Allocation for 2010: 5% real estate, 35% global stocks, 5% money market, 55% USA stocks. This was when I was young and accumulating my retirement portfolio.
Today, investment conditions make investing in retirement more difficult than normal. With interest rates so low bonds provide little yield and have increased risk (due to how much long term bond prices would fall if interest rates rise, given how low interest rates are today). And with stocks so highly valued the likelihood of poor long term returns at these levels seems higher than normal.
So the 2 options for the simplest version of portfolio allocation are less attractive than usual, provide lower income than usual and have great risk of decline than usual. That isn’t a good situation.

View of Glacier National Park (a nice place to go in retirement, or before retirement) by John Hunter
I do think looking for dividend stocks to provide some current yield in this situation makes sense. And in so doing substitute them for a portion of the bond portfolio. This strategy isn’t without risk, but given the current markets I think it makes sense.
I have always thought including real estate as part of a portfolio was wise. It makes even more sense today. In the past Real Estate Investment Trusts (REITs) were very underrepresented in the S&P 500 index, in 2016 and 2017 quite a few REITs were added. This is useful to provide some investing in REITs for those who rely on the S&P 500 index funds for their stock investments. Still I would include REIT investments above and beyond their portion of the S&P 500 index. REITs also provide higher yields than most stocks and bonds today so they help provide current income.
While I am worried about the high valuations of stocks today I don’t see much option but to stay heavily invested in stocks. I generally am very overweight stocks in my portfolio allocation. I do think it makes sense to reduce how overweight in stocks my portfolio is (and how overweight I think is sensible in general).
Amazon announced they are opening major new offices in Arlington, Virginia and New York City. Each site will hold 25,000 new Amazon employees at an average salary above $150,000. Getting to that level with take many years, next year under 1,000 employees will be at each site.
I lived in Arlington for many years and own rental property there. The Amazon decision is likely to catalyze a much more rapid ascent of the technology sector in the DC area. The DC area has a strong foundation of internet technology to build upon, though many people are not aware of this. The Amazon move will likely help shift the perception of the DC area as government driven and the growth of internet technology activity in the area is likely to grow rapidly.
The 25,000 jobs (even with a greater than average salary of $150,000) isn’t the main impact of the announcement. The big news is the likelihood of Amazon’s highly visible efforts catalyzing more tech businesses (especially 5-7 years down the road when some of the Amazon people start creating their own startups). It isn’t that Amazon is moving into a barren tech landscape, there is already a strong base from which to launch a long term tech boost to the DC area economy.
The direct impact of Amazon’s employees renting and buying in and around Arlington is not going to be very strong for a couple years. Amazon plans to add 500 people to Arlington in 2019; 1,000 more in 2020 and 2,000 more in 2021. But investors already can plan for a strong future demand from Amazon and all the activity that Amazon’s growing presence will contribute to.

I am actually selling my house in Arlington (in this photo), with a very nice yard (explanation below).
The increase in housing prices in 2019 and 2020 will be primarily investor driven. In 2020, 2021 and going forward the impact of Amazon employees directly and all the extra activity spurred on will start to have an impact. Unlike the stock market where such a predicable strong investment future would drive prices up say 30-50% immediately, in real estate it is much more likely for the gains to be spread out over the long term.
If prices in housing increase in Arlington it is more likely they would increase say 10% in the first year and then an extra 3% (above what the increase would have been without Amazon’s move) each of the next 10 years. From a long term investors perspective this provides a great possibility for buying now (even after the news) and not having to pay a huge premium.
Rental housing prices are not likely to go up much immediately. And they will take longer to show up in the market, they will be much more closely tied to new job additions (from Amazon and others). So investors have to pay a higher price today (say 5-10% higher) and in the first 1 or 2 years probably see no higher rents than they would have otherwise. And even after 2021 those rents are likely to go up more slowly than prices of real estate.
Abuse of the credit system by 3rd party collection agencies (and credit reporting agencies) in the USA has been a long term problem.
An attempt to partially address some of the abuses was a change in the required reporting practices that impacted collections accounts specifically, known as the National Consumer Assistance Plan (NCAP), which rolled into effect during the second half of 2017. The plan has many components, including: (1) a requirement for more frequent, detailed, and accurate reporting of collections accounts, including reflecting when those accounts have been paid; (2) a prohibition against reporting debts that did not arise from an agreement to pay, or from, medical collections less than 180 days old; (3) the removal of collections accounts that did not arise from a contract or agreement to pay; and (4) permission to report any account only when there is sufficient information to link the account with an individual’s credit files (requiring a name, address, and some other personally identifying information such as a Social Security number or date of birth).
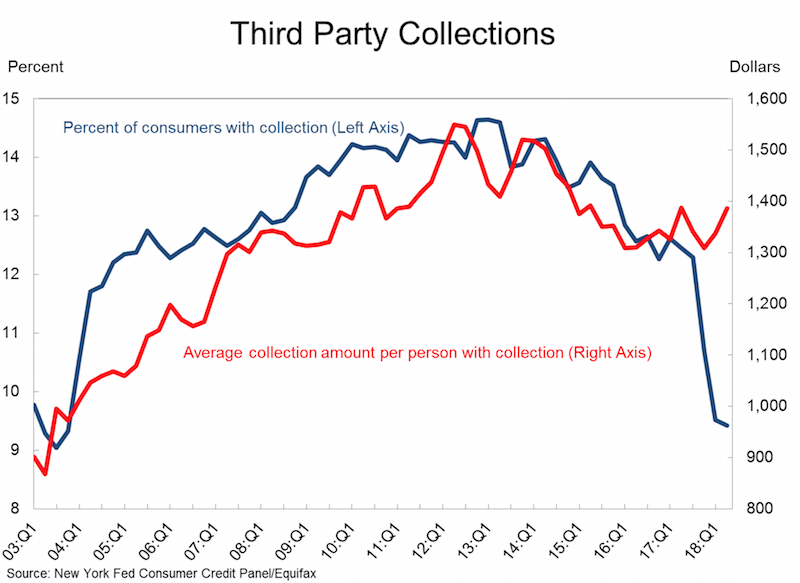
All in all, the changes in credit reporting prompted by the National Consumer Assistance Plan have resulted in an $11 billion reduction in the collections accounts balances being reported on credit reports. A total of 8 million people had collections accounts completely removed from their credit report. However, collections accounts do indeed align with other negative events and the cleanup of collections accounts had the largest impact on the borrowers with the lowest scores.
These borrowers will certainly benefit in the long run from the cleanup of their credit reports, since higher scores are associated with better access to credit, to the job market, and even to the rental housing market. But the immediate impact of the removal of collections will be muted for most of those affected (other items are also impacting their current credit score).
In the longer-term there may be a rebound in collections account reporting because creditors will likely begin collecting the newly required personally identifying information as they adjust to this reporting change.
This was a small good step in protecting consumers from the bad behavior of credit reporting companies and their customers. But much more must be done to protect us from having our financial lives negatively impacted by bad practices of the credit reporting companies.
Related: Cleaning Up Collections – Avoiding the Vicious Cycle of Credit Problems – Truly Free Credit Report – USA Household Debt Jumps to Record $13.15 Trillion
The Federal Reserve Bank of New York’s Center for Microeconomic Data today issued its Quarterly Report on Household Debt and Credit, which reported that total household debt increased by $193 billion (1.5%) to $13.15 trillion in the fourth quarter of 2017. This report marks the fifth consecutive year of positive annual household debt growth. There were increases in mortgage, student, auto, and credit card debt (increasing by 1.6%, 1.5%, 0.7% and 3.2% respectively) and another modest decline in home equity line of credit (HELOC) balances (decreasing by 0.9%).
Outstanding consumer debt balances by type: $8.88 trillion (mortgage), $1.38 trillion (student loans), $1.22 trillion (auto), $834 billion (credit card), $444 (HELOC).
Mortgages are the largest form of household debt and their increase of $139 billion was the most substantial increase seen in several quarters. Unlike overall debt balances, which last year surpassed their previous peak reached in the third quarter of 2008, mortgage balances remain 4.4% below it. The New York Fed issued an accompanying blog post to examine the regional differences in mortgage debt growth since the previous peak.

As of December 31, 4.7% of outstanding debt was in some stage of delinquency. As the chart shows mortgage and credit card debt delinquency rates have decreased sharply since 2010. Student loan debt delinquency rates have increased substantially during the same period (and delinquency rates for student loans are likely to understate effective delinquency rates because about half of these loans are currently in deferment, in grace periods or in forbearance and therefore temporarily not in the repayment cycle. This implies that among loans in the repayment cycle delinquency rates are roughly twice as high). You can understand why many see student debt as a huge economic problem the economy is facing in the coming years.
Of the $619 billion of debt that is delinquent, $406 billion is seriously delinquent (at least 90 days late or “severely derogatory”). The flow into 90+ days delinquency for credit card balances has been increasing notably from the last year and the flow into 90+ days delinquency for auto loan balances has been slowly increasing since 2012.
Apple analysts are of no value to investors
If the stock moved more than 2% on any uptick in volume, I had to write a story explaining why. After dealing with that every day for about three years, I realized the overwhelming majority of analysts had no better clue than I did about what was moving Cisco’s stock.
Most investors know this, but if you don’t remember this lesson. The “explanations” you hear from media often are just as useless as horoscopes. A bunch of meaningless words presented in the hopes you don’t realize they are empty words.
The talking heads (and writers) need to say something. It would be much more useful if they took the time to do some research and put in some thought but they seem to be driven by the need to fill space instead of the need to inform.
It is also a huge waste of time, explaining random variation.
Related: Fooled by Randomness – Seeing Patterns Where None Exists – Illusions, Optical and Other – Understanding Data
Health Savings Accounts (HSA) allow you to save money in order to pay health expenses in a tax free account. They are similar to an IRA but are for health expenses.
Eligibility is limited to those with high deductible health care plans.
HSA funds can be saved over the years. Flexible spending accounts are somewhat similar but that money can not be rolled from one year to the next. The idea with HSA is you can save money in good years so you have money to pay health care expenses in years when you have them.
Health Savings Accounts are meant to cover deductibles, co-pays, uncovered health needs etc. that those stuck with the current USA health care system have to deal with. HSA are best used by people who are healthy, as the idea is to save up money during healthy years so there is a cushion of funds to pay health expenses later.
Health Savings Accounts are not a substitute for health care insurance. The health care system in the USA is so exorbitantly expensive only the very richest could save enough even for relatively minor health needs that are free to all citizens in most rich countries. HSA are legally available to you without health insurance but doing without health insurance in the USA is a disastrous personal financial action in the USA.
And the system is even worse in having ludicrously high charges that all insurance companies get huge discounts on. But if you try to use the USA health system without insurance the unconscionable charges that no insurance company pays will be billed to you. Even if your insurance company paid nothing, the reduction in fees just due to providers not charging the massive uninsured premium charges is critical.
Your HSA contribution is taken out of your paycheck on a pre-tax basis and grows tax deferred.
Withdrawals from an HSA for qualified medical expenses are free from federal income tax. At age 65, you can withdraw money from the HSA to use in retirement for expenses not related to health care. You will owe taxes at this time, but no penalty.
Related: 2015 Health Care Price Report, Costs in the USA and Elsewhere – Health Insurance Considerations for Digital Nomads – Personal Finance Basics: Health Insurance
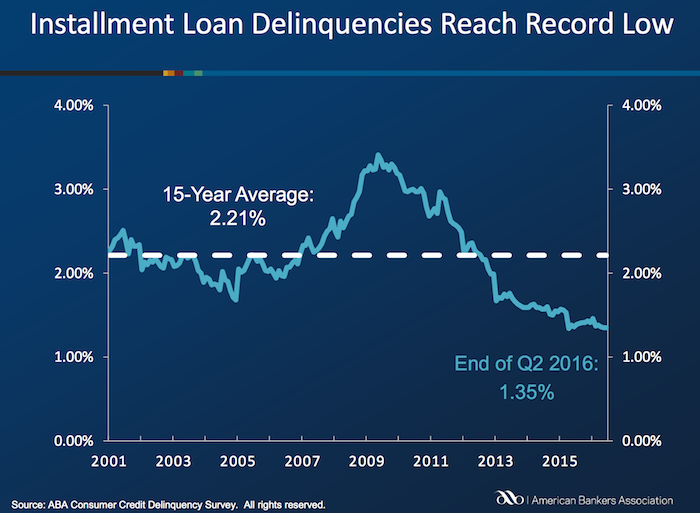
Delinquencies in closed-end loans fell slightly in the second quarter, driven by a drop in home equity loan delinquencies, according to results from the American Bankers Association’s Consumer Credit Delinquency Bulletin.
The composite ratio, which tracks delinquencies in eight closed-end installment loan categories, fell 3 basis points to 1.35% of all accounts – a record low. This also marked the third year that delinquency rates were below the 15-year average of 2.21%. The ABA report defines a delinquency as a late payment that is 30 days or more overdue. This is good news but the personal financial health of consumers in the USA is still in need of significantly improvements to their balance sheets. Debt levels are still too high. Savings levels are still far to low.
Home equity loan delinquencies fell 4 basis points to 2.70% of all accounts, which helped drive the composite ratio down. Other home related delinquencies increased slightly, with home equity line delinquencies rising 6 basis points to 1.21% of all accounts and property improvement loan delinquencies rising 2 basis points to 0.91% of all accounts. Home equity loan delinquencies dipped further below their 15-year average of 2.85%, while home equity line delinquencies remained just above their 15-year average of 1.15 percent.
Bank card delinquencies edged up 1 basis point to 2.48% of all accounts in the second quarter. They remain significantly below their 15-year average of 3.70 percent.
The second quarter 2016 composite ratio is made up of the following eight closed-end loans. All figures are seasonally adjusted based upon the number of accounts.
Closed-end loans
Home equity loan delinquencies fell from 2.74% to 2.70%.
Mobile home delinquencies fell from 3.41% to 3.17%.
Personal loan delinquencies fell from 1.44% to 1.43%.
Direct auto loan delinquencies rose from 0.81% to 0.82%.
Indirect auto loan delinquencies rose from 1.45% to 1.56%.
Marine loan delinquencies rose from 1.03% to 1.23%.
Property improvement loan delinquencies rose from 0.89% to 0.91%.
RV loan delinquencies rose from 0.92% to 0.96%.
Open-end loans
Bank card delinquencies rose from 2.47% to 2.48%.
Home equity lines of credit delinquencies rose from 1.15% to 1.21%.
Non-card revolving loan delinquencies rose from 1.57% to 1.65%.
Related: Debt Collection Increasing Given Large Personal Debt Levels (2014) – Consumer and Real Estate Loan Delinquency Rates from 2001 to 2011 in the USA – Good News: Credit Card Delinquencies at 17 Year Low (2011) – Real Estate and Consumer Loan Delinquency Rates 1998-2009 – The USA Economy Needs to Reduce Personal and Government Debt (2009)
This post continues our series on peer-to-peer lending (and LendingClub): Peer to Peer Portfolio Returns and The Decline in Returns as Loans Age, Investing in Peer to Peer Loans. LendingClub, and other peer-to-peer lenders let you use filters to find loans that meet your criteria. So if you chose to take more, or less, risk you can use filters to find loans fitting your preferences. Those filters can also be applied to automate your lending.
There are resources online to help you understand the past results of various investing strategies (returns based on various filters). Some filter are just a trade-off of risk for return. You can invest in grade A (a LendingClub defined category) loans that have the lowest risk, and the lowest interest rates and historical returns. Or you can increase your risk and get loans with higher interest rates and also higher historical returns (after factoring in defaults).

Description of chart: This chart shows the historical performance by grade for all issued loans.
This chart includes all loans that were issued 18 months or more before the last day of the most recently completed quarter. The historical returns data in the chart is updated monthly.
Adjusted Net Annualized Return (“Adjusted NAR”) is a cumulative, annualized measure of the return on all of the money invested in loans over the life of those loans, with an adjustment for estimated future losses.
LendingClub lets you set filters to use to automatically invest in new loans as funds are available to invest (either you adding in new money or receiving payments on existing loans). This is a nice feature, there are items you can’t filter on however, such as job title. And also you can’t make trade-offs, say given x, y and z strong points and a nice interest rate in this loan I will accept a bit lower value on another factor.
So I find I have to be a bit less forgiving on the filter criteria and then manually make some judgements on other loans. For me I add a bit higher risk on my manual selections. I would imagine most people don’t bother with this, just using filters to do all the investing for them. And I think that is fine.
Practically what I do so that I can make some selections manually is to set the criteria to only be 98% invested. This will cause it to automatically invest any amount over 2% that is not invested. You can set this to whatever level you want and also is how you can make payments to yourself. I will say I think one of the lamest “features” of LendingClub is that is has no ability to send you regular monthly checks. So you have to manually deal with it.
It should be simple for them to let you set a value like send me $200 on the 15th of each month. And then it manages the re-investments knowing that and your outstanding loans. But they still don’t offer that feature.
As I said one of the factors in setting filters is managing risk v. reward but the other is really about weaknesses in the algorithm setting rates. You can just see it as risk-reward trade-off but I think it is more sensible to see 2 different things. The algorithm weaknesses are factors that will fluctuate over time as the algorithm and underwriting standards are improved. For example, loans in California had worse returns (according to every site I found accessing past results). There is no reason for this to be true. If a person with the exactly same profile is riskier in California that should be reflected in higher rates and thus bring the return into balance. My guess is this type of factor will be eliminated over time. But if not, or until it is, fixed filtering out loans to California makes sense.
Once you set your filter criteria then you select what balance you want between A, B, C, D, E and FG loans. I set mine to
A 2%
B 16%
C 50%
D 20%
E 10%
I actually have a bit over 1% in FG (but I select those myself). In 2015 the makeup of the loans given by LendingClub was A 17%, B 26%, C 28%, D 15%, E 10%, F and G 4%.
Related: Where to Invest for Yield Today (2010) – Default Rates on Loans by Credit Score – Investing in Stocks That Have Raised Dividends Consistently – Investment Risk Matters Most as Part of a Portfolio, Rather than in Isolation
Sadly Lending Club uses fragile coding practices that result in sections of the site not working sometimes. Using existing filters often fails for me – the code just does nothing (it doesn’t even bother to provide feedback to the user on what it is failing to do). Using fragile coding practices sadly is common for web sites with large budgets. Instead of using reliable code they seems to get infatuated with cute design ideas and don’t bother much making the code reliable. You can code the cute design ideas reliably but often they obviously are not concerned with the robustness of the code.