I created a 10 stocks for 10 years portfolio in April of 2005 which I shared on this blog. It did very well.
Over the years I adjusted the portfolio occasionally. Unfortunately the website I used to track results stopped doing that (and it is much more difficult to track results – with dividends, stock splits, spinoff… than you might suppose). I estimate I beat the S&P 500 by maybe 300 basis points annually (for the portfolio with slight adjustment over time, which is the one I tracked).
With this post I have created a new 10 stocks for 10 years portfolio.
The 10 stocks I came up with are (closing price on 22 April 2005 – % of portofilo invested):
- Tencent (TCEHY) – $43 and 15% (using the USA ADR). A phenomenal company with incredible global prospects for the long term. As the stock price has been hampered by concerns about China it has great potential for appreciation from the current price.
- Alibaba (BABA) – $175 and 15% (using USA ADR). Another phenomenal company with incredible global prospects that has performed poorly this year due to China concerns.
- Alphabet (GOOGL) – $1,254 and 11% (in the original 2005 portfolio the price was $216 and it started at 12% of the portfolio. The prospects are great long term, the stock price reflects that so it isn’t cheap but over the long term I expect it to do very well).
- Apple (AAPL) – $225 and 11% (I added Apple to the original 10 for 10 portfolio in 2010. The biggest mistake in the original portfolio was leaving off Apple, I considered it but chose not to include it. It has been my largest stock holding for years. It has been very cheap even just a few years ago, though today I think the price is much more reasonable so it isn’t the great bargin it has been. Still the long term prospects are great.)
- Abbvie (ABBV) – $97 and 10% (I added Abbive to the original portfolio in 2014. I would select a couple other healthcare stocks in a real invested portfolio for balance but Abbvie is the company I am most comfortable with so I include it here.)
- Toyota (TM) $125 and 9% (in the 2005 portfolio the price was $72 and it made up 12% of the portfolio). I believe the company is very well managed and the long term prospects are good though I am a bit worried about autonomous cars and the future of transportation. A potential new market for Toyota is robotics but they have not been as aggressive with software development innovation as I would hope on that front. The companies I am most interested in are very internet focused and I don’t like how concentrated that makes this portfolio so adding Toyota and Abbive adds a bit of diversity, though obviously not much)
- Amazon (AMZN) – $2,002 and 8% (in the 2005 portfolio the price was $33 a share, it was by far the best performer. It started as 8% of the original 2005 portfolio. I am very high on the prospects for the company, the stock price is what leads me to limit it to 8% of the new portfolio.)
- Naspers (NPSNY) – $33 and 8% (bought 30 October 2018, the company is largely a proxy for Tencent but also has many other significant investments in internet companies, the decline in Tencent, along with the Chinese market decline, and therefore the decline in Naspers just makes it too good an opportunity to pass up)
- Vanguard Health Care Index Fund (VHT) – $177 and 8% (I can’t decide on what other health care stock to hold for 10 years but I believe strongly in global growth of health care investments over the next 10 years so I settled on this low expense ETF.)
- Danaher (DHR) – $103 and 5% (I like this company but honestly the biggest reason for including it is to get some more diversity in the portfolio. I added it to the 2005 portfolio in 2008.)
I strongly believe that 10 years from now the Chinese stock market will have performed extremely well. There are of course numerous substantial worries about Chinese investments (the real estate bubble, high debt levels, “Great Firewall”, difficult government regulatory environment, restrictions on the press, restrictions on open debate…) but there are many reasons to be very optimistic about the long term prospects for China’s economic growth and the very promising leading companies prospects: such as Tencent, Alibaba, Baidu, Ctrip….
At this time it seems to me that the stock prices of leading Chinese companies are being held down compared to other leading companies (Apple, Google, Amazon…). Either the USA companies are overvalued or the Chinese ones are very under-valued or the global economy outside the USA is going to do very poorly in the next 10 years. Google, Apple etc. make a huge amount overseas but they have more earnings in the USA than Tencent and Alibaba (which still have almost none in the USA though their global business, outside China, is growing extremely rapidly).
One very big factor that I believe will support Chinese stock prices over the next 10 to 20 years is an large increase in the holdings of stocks by those in China. The current distribution of savings in China has extremely limited stock investments (and much larger bank savings accounts and real estate investments than in other countries). I expect that to change with a large increase in stock investing in China over the next 10 to 20 years.
Two other companies that are interesting are Naspers (which owns a huge amount of Tencent) and Softbank (which owns a large amount of Alibaba). Softbank has a large portfolio of investments in leading technology companies globally though much of it is held in a somewhat complicated manner. Naspers is more focused but also has a strong global portfolio. One of the very important aspects of Alibaba and Tencent is their huge portfolio of technology company investments made at the venture capital stage mostly (Google also has quite a few more investments than most people realize). I also believe Vanguard Emerging Market ETF (VWO) is a very good long term investment.
I wouldn’t be surprised if Chinese stocks had difficulty in the next year or two but long term stocks such as Alibaba and Tencent offer the best prospects considering realistic expectations for possible rewards compared to the risk investing in them poses today.
This portfolio is not meant to be a complete personal financial portfolio (at most it would be a portion of the portfolio allocated to equity holdings). Previous posts on portfolio allocation: Investment Risk Matters Most as Part of a Portfolio, Rather than in Isolation, Investment Options Are Much Less Comforting Than Normal These Days (2013) and Investing Return Guesses While Planning for Retirement.
The Federal Reserve Bank of New York’s Center for Microeconomic Data today issued its Quarterly Report on Household Debt and Credit, which reported that total household debt increased by $193 billion (1.5%) to $13.15 trillion in the fourth quarter of 2017. This report marks the fifth consecutive year of positive annual household debt growth. There were increases in mortgage, student, auto, and credit card debt (increasing by 1.6%, 1.5%, 0.7% and 3.2% respectively) and another modest decline in home equity line of credit (HELOC) balances (decreasing by 0.9%).
Outstanding consumer debt balances by type: $8.88 trillion (mortgage), $1.38 trillion (student loans), $1.22 trillion (auto), $834 billion (credit card), $444 (HELOC).
Mortgages are the largest form of household debt and their increase of $139 billion was the most substantial increase seen in several quarters. Unlike overall debt balances, which last year surpassed their previous peak reached in the third quarter of 2008, mortgage balances remain 4.4% below it. The New York Fed issued an accompanying blog post to examine the regional differences in mortgage debt growth since the previous peak.

As of December 31, 4.7% of outstanding debt was in some stage of delinquency. As the chart shows mortgage and credit card debt delinquency rates have decreased sharply since 2010. Student loan debt delinquency rates have increased substantially during the same period (and delinquency rates for student loans are likely to understate effective delinquency rates because about half of these loans are currently in deferment, in grace periods or in forbearance and therefore temporarily not in the repayment cycle. This implies that among loans in the repayment cycle delinquency rates are roughly twice as high). You can understand why many see student debt as a huge economic problem the economy is facing in the coming years.
Of the $619 billion of debt that is delinquent, $406 billion is seriously delinquent (at least 90 days late or “severely derogatory”). The flow into 90+ days delinquency for credit card balances has been increasing notably from the last year and the flow into 90+ days delinquency for auto loan balances has been slowly increasing since 2012.
Apple analysts are of no value to investors
If the stock moved more than 2% on any uptick in volume, I had to write a story explaining why. After dealing with that every day for about three years, I realized the overwhelming majority of analysts had no better clue than I did about what was moving Cisco’s stock.
Most investors know this, but if you don’t remember this lesson. The “explanations” you hear from media often are just as useless as horoscopes. A bunch of meaningless words presented in the hopes you don’t realize they are empty words.
The talking heads (and writers) need to say something. It would be much more useful if they took the time to do some research and put in some thought but they seem to be driven by the need to fill space instead of the need to inform.
It is also a huge waste of time, explaining random variation.
Related: Fooled by Randomness – Seeing Patterns Where None Exists – Illusions, Optical and Other – Understanding Data
This post lists the 20 publicly traded companies with the largest market capitalization as of today. Since my May 2017 list of the 20 most valuable stocks many of the market caps have increased significantly.
In the 20 most valuable companies list there are 13 USA companies, 4 Chinese companies and 1 each for Korea, Netherlands and Switzerland. The remaining 17 companies with market caps above $200 billion are based in: USA 8, China 5, Switzerland 2, Japan 1 and Taiwan 1.
| Company | Country | Market Capitalization | |
|---|---|---|---|
| 1 | Apple | USA | $898 billion |
| 2 | Alphabet (GOOGL) | USA | $729 billion |
| 3 | Microsoft | USA | $642 billion |
| 4 | Amazon | USA | $572 billion |
| 5 | USA | $531 billion | |
| 6 | Tencent | China | $506 billion* |
| 7 | Alibaba | China | $492 billion |
| 8 | Berkshire Hathaway | USA | $451 billion |
| 9 | Johnson & Johnson | USA | $371 billion |
| 10 | Exxon Mobil | USA | $345 billion |
Tencent (China) soared $192 billion (61%) since my May 2017 post (after a 85% gain shown in the last post – behind only Samsung for largest percentage gain in that post). That gain pushed Tencent over a $500 billion market cap and moved them from 10th most valuable to 6th. Alibaba also soared $192 billion (64% for them) and moved into the top 10.
Apple gained $73 billion in market cap and is closing in on a market cap over $1 trillion since my May 2017 post. Microsoft, which continues to gain value rapidly even though it is not getting the attention of many of the internet companies, increased by $117 billion. Amazon added $106 billion to their market cap in the last 6 months. Alphabet (Google) gained $77 billion while Facebook increased by $94 billion.
The next ten most valuable companies:
| Company | Country | Market Capitalization | |
|---|---|---|---|
| 11 | JPMorgan Chase | USA | $341 billion |
| 12 | Industrial & Commercial Bank of China (ICBC) | China | $319 billion* |
| 13 | Samsung | Korea | $310 billion |
| 14 | Walmart | USA | $289 billion |
| 15 | China Unicom | China | $281 billion |
| 16 | Bank of America | USA | $277 billion |
| 17 | Wells Fargo | USA | $267 billion |
| 18 | Nestle | Switzerland | $267 billion |
| 19 | Royal Dutch Shell | Netherlands | $260 billion |
| 20 | Visa | USA | $254 billion |
Market capitalization shown are of the close of business November 26th, as shown on Google Finance.
GE continued to collapse, dropping another 62 billion add dropping well out of the top 20 (they were one of the 10 most valuable companies in 2016).
The total value of the top 20 gained $1.2 trillion since my February, 2016 post: growing from $7.2 trillion to $8.4 trillion. Remember, the companies making up the top 20 has changed (China Unicom, Visa and Royal Dutch Shell were added while GE, China Mobile and Roche dropped out).
As I noted in Stock Market Capitalization by Country from 2000 to 2016: Apple, Alphabet, Microsoft, Facebook and Amazon have a combined market capitalization greater than the entire stock market in every country but those in the USA, China and Japan.
Related: Global Stock Market Capitalization from 2000 to 2012 – Stock Market Capitalization by Country from 1990 to 2010 – Historical Stock Returns
A few other companies of interest (based on their market capitalization):
The total stock market capitalization by country gives some insight but it is also data that is a bit muddy. The data doesn’t tell you how the economies of the countries are doing as there is quite a bit of room for misinterpreting the data.
Apple, Alphabet, Intel, 3M, Abbvie… all are included in the USA market capitalization but much of their sales, earnings and employment are overseas. And USA companies have done very well in global markets so the USA totals are not just an indication how the USA has performed but includes great gains made by profiting from global growth. Also you may be surprised to learn that 26% of USA equities are owned by investors outside the USA.
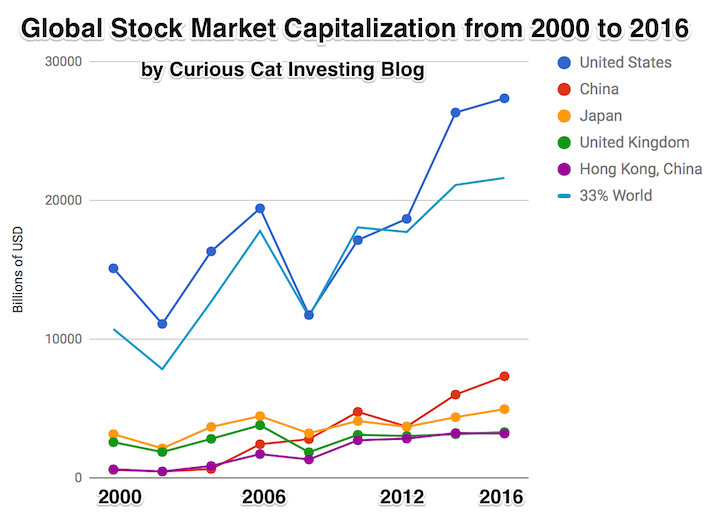
The chart shows the top countries based on stock market capitalization, with data from 2000 to 2016. The chart was created by Curious Cat Investing and Economics Blog may be used with attribution. Data from the World Bank.
It is important to keep in mind the data is shown in current USA dollars, so large swings in exchange rates can have a large impact.
China’s performance has been remarkable. China also shows some of the challenges in collecting this data. I am fairly certain Alibaba (BABA), one of the 10 most valuable companies in the world and a Chinese company has the stock issued in the USA (even this is confusing as it is a complex arrangement but the only publicly traded stock is traded in the USA). And many other Chinese companies are traded this way and therefore are not included in the Chinese total value. In addition Hong Kong is part of China but also separate. The data is reported separately by the world bank and I include them that way in the charts.
As with so much recent economic data China’s performance here is remarkable. China grew from 1.8% of world capitalization in 2000 to 6.9% in 2012 and 11.2% in 2016. Adding Hong Kong to China’s totals shows 3.7% in 2000 with growth to to 12.2% in 2012 and 16.2% in 2016. If you look at my post global stock market capitalization from 2000 to 2012 you will see significantly different historical data for Hong Kong. Collecting this data is much more complex than people realize and data determinations can change over the years resulting in changes in historical data.
The chart shows the 1/3 of the total global market capitalization in order to have the chart display look better (and it also makes it easier to compare the USA performance to the total global performance). The USA market capitalization was at 46.9% of the global market cap in 2000 and fell to 31.6% in 2000 before rising to 42% in 2016. This shows that the USA has largely held its own globally as measured by market cap. This may not seem impressive but when you consider that China has grown from 3.7% to 16.2% you can see that for the market cap outside of China the USA has actually gained quite a bit of ground. This is the result of what I mentioned before – how well USA companies have done at capture global markets (especially in high technology areas with very high profits and therefore very high market caps).
The latest massive breach of USA citizen’s private information by poorly run companies once again shows how we are voting for the wrong type of people. We need to start electing people that fix problems instead of watching things burn.
It is not impossible to improve if you elect people that care about making things better. If you elect people that are driven mainly by doing favors for those giving them cash you get the system we have now.
I believe in designing systems that use markets to create the best solutions to desired outcomes (this is the basic idea of real capitalism – instead of the crony capitalism we have been infected with). Europe has much more respect for citizen’s privacy that the USA does. Europe has much more effect laws on protecting citizen’s privacy. For decades the 2 political parties in the USA have taken large cash donations (and more, future cushy jobs…) to allow the current system to punish citizen’s as their private information is abused and they are expected to spend their time and resources to fix the problems created by the identity theft the lack of decent systems in the USA to stop identity theft. And the design by the 2 parties to put the cost of dealing with it on voters and the benefits (of selling private consumer information and using poor security practices to create problems that voters have to clean up) to those giving the parties cash.
We need to stop voting for such corrupt parties and such poor representatives of our interests (though they are very good representatives of those paying them cash).
So what is a simple starting point for taking the burden of dealing with the easy identity theft our political parties and companies that don’t care about the costs of their sloppy practices on society are?
- Force those approving false credit to pay. Anytime you have to fix credit given falsely in your name they must pay you. Say, $1,000 minimum.
- Force those providing false information about you to pay. If credit bureaus report false information about you that you must correct it is $50 if it is fixed within 7 days of a simple internet form being completed. If it takes 30 days the cost is $150. If they require you to provide additional information, additional costs accrue. They must provide your the original documentation on the loans.
- Give consumer automatic and free control over the use of their private information.
Obviously, credit freezes, and managing that status must be free. - Any organization that collects private financial information must have liability insurance. That insurance will automatically pay per security breach. For name + SSN ($150) + Date of birth ($20) + cell phone number ($20) + current address ($100) + credit card number ($50) + email address ($10) + mother’s maiden name ($25), etc. If you do not collect SSN, credit card number, cell phone number or current address this will not apply. I haven’t given it any thought, but there should be some level of private information that pushes you into the category of the organization that must have liability coverage (what that is can be worked out).
- The funds for those security breaches are paid to the Consumer Financial Protection Bureau and used to
- create better security practices for private information
- fund enforcement of those better security practices
- fund law enforcement investigations and criminal prosecution of those abusing private financial information
This idea needs to be expanded beyond my 1 hour of thinking about it, but it is sad that in 1 hour I can think of much more effective ideas than our political parties have put in place in 20 years.
The reliance on SSN as a identifier for people is something that shouldn’t have been allowed. It is one of many things that should be fixed and it should be fixed quickly.
The organization created here needs to focus on privacy of data. They need to encourage the use of encryption. They need to be given a seat at the table to counter those seeking to promote hacking (both leaving insecure software in place and creating insecurity in the software ecosystem to exploit and be exploited by criminals and other states) to benefit state sponsored spying. That debate will result in tradeoffs. Sometimes they will decide to allow our private information to be put at risk for other benefits. But they need to accept the responsibility of doing so. It would likely be sensible to charge the departments leaving open security holes and creating security holes anytime it becomes obvious that they are responsible for the harm to us. Otherwise they pretend there are not costs to the very bad security practices that our government has been encouraging (even as crazy as it sounds building backdoors into software – which is a security disaster obviously).
Other than the extremely sad state of affairs in health care in the USA (with the Republicans focusing on making it much worse) the biggest threat to our personal finances is likely the lack of security in our financial system (though to be fair there are other plausible candidates – very high debt level…).
Related: Protecting Your Privacy and Security (2015) – Making Credit Cards More Secure and Useful (2014) – Governments Shouldn’t Prevent Citizens from Having Secure Software Solutions USA Congress Further Aids Those Giving Them Cash Risks Economic Calamity Again – Security, Verification of Change – 8 Million New Potential Victims of Identity Theft (2008)
I have decided to wind down my investment test with LendingClub. I should end up with a investment return of about 5% annually. So it beat just leaving the money in the bank. But returns are eroding more recently and the risk does not seem worth the returns.
Early on I was a bit worried by how often the loan defaulted with only 0, 1 or 2 payments made. Sure, there are going to be some defaults and sometimes in extremely unlucky situation it might happen right away. But the amount of them seems to me to indicate LendingClub fails to do an adequate job of screening loan candidates.
Over time the rates LendingClub quoted for returns declined. The charges to investors for collecting on late loans were very high. It was common to see charges 9 to 10 times higher as the investor than were charged to the person that took out the loan and made the late payment.
For the last 6 months my account balance has essentially stayed the same (bouncing within the same range of value). I stopped reinvesting the payments received from LendingClub loans several months ago and have begun withdrawing the funds back to my account. I will likely just leave the funds in cash to increase my reserves given the lack of appealing investment options (and also a desire to increase my cash position in given my personal finances now and looking forward for the next year). I may invest the funds in dividend stocks depending on what happens.
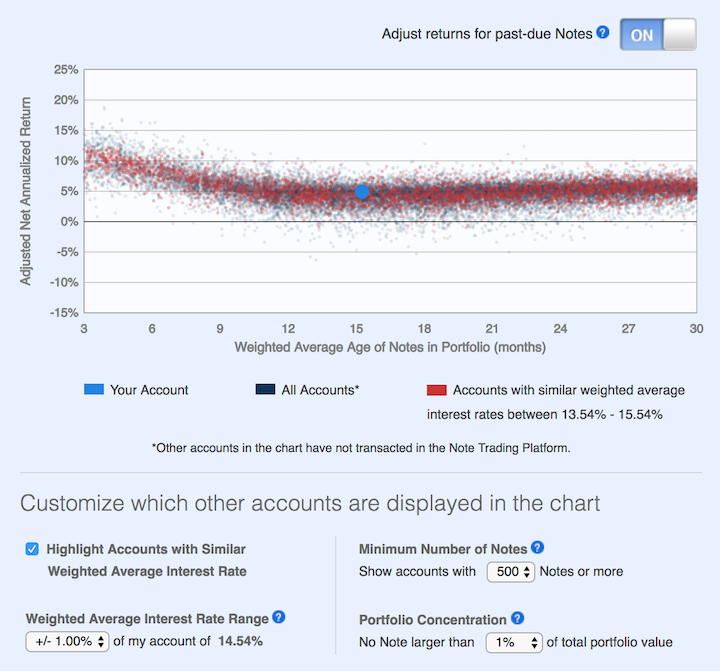
This chart shows lending club returns for portfolios similar to mine. As you can see a return of about 5% is common (which is about where I am). Quite a few more than before actually have negative returns. When I started, my recollection is that their results showed no losses for well diversified portfolios.
The two problems I see are poor underwriting quality and high costs that eat into returns. I do believe the peer to peer lending model has potential as a way to diversify investments. I think it can offer decent rates and provide some balance that would normally be in the bond portion of a portfolio allocation. I am just not sold on LendingClub’s execution for delivering on that potential good investment option. At this time I don’t see another peer to peer lending options worth exploring. I will be willing to reconsider these types of investments at a later time.
I plan to just withdraw money as payments on made on the loans I participated in through LendingClub.
Related: Peer to Peer Portfolio Returns and The Decline in Returns as Loans Age (2015) – Investing in Peer to Peer Loans – Looking for Yields in Stocks and Real Estate (2012) – Where to Invest for Yield Today (2010)
This post lists the 20 publicly traded companies with the largest market capitalization as of today. Since my February 2016 list of the 20 most valuable stocks many of the market caps have increased significantly.
| Company | Country | Market Capitalization | |
|---|---|---|---|
| 1 | Apple | USA | $825 billion |
| 2 | Alphabet (GOOGL) | USA | $652 billion |
| 3 | Microsoft | USA | $525 billion |
| 4 | Amazon | USA | $466 billion |
| 5 | USA | $437 billion | |
| 6 | Berkshire Hathaway | USA | $403 billion |
| 7 | Exxon Mobil | USA | $350 billion |
| 8 | Johnson & Johnson | USA | $334 billion |
| 9 | Samsung | Korea | $316 billion** |
| 10 | Tencent | China | $314 billion* |
Apple gained an amazing $284 billion in market cap since my February 2016 post. Only 12 companies (including Apple) are worth more than $284 billion. Amazon soared $204 billion (a 78% increase). Alphabet (Google) gained $156 billion in market cap.
Samsung soared $163 billion (a 107% gain) and Tencent soared $144 billion (a 85% gain) to move from outside the top 20 to become the 9th and 10th most valuable companies and the most valuable based outside the USA.
Facebook gained $126 billion and Microsoft gained $117 billion. GE lost $60 billion to drop out of the top ten. Wells Fargo also dropped out of the top 10.
The next ten most valuable companies:
| Company | Country | Market Capitalization | |
|---|---|---|---|
| 11 | JPMorgan Chase | USA | $308 billion |
| 12 | Alibaba | China | $298 billion |
| 13 | Wells Fargo | USA | $261 billion |
| 14 | Industrial & Commercial Bank of China | China | $258 billion* |
| 15 | Nestle | Switzerland | $253 billion |
| 16 | GE | USA | $240 billion |
| 17 | Bank of America | USA | $238 billion |
| 18 | Roche | Switzerland | $231 billion |
| 19 | Walmart | USA | $228 billion |
| 20 | China Mobile | China | $225 billion* |
Market capitalization shown are of the close of business May 12th, as shown on Google Finance.
In the 20 most valuable companies list there are 13 USA companies, 4 Chinese companies, 2 Swiss companies and 1 Korean company.
Alibaba (China) soared $131 billion (78%) and climbed to the 11th spot (from outside the top 20 last time). Bank of America soared $105 billion (up 79%).
Verizon was one of 2 companies in the top 20 to lose value in the period, Verizon declined $23 billion (over 10%) and dropped out of the top 20.
The total value of the top 20 gained $1.3 trillion since my February, 2016 post: growing from $5.9 trillion to $7.2 trillion. Remember, the companies making up the top 20 has changed.
Related: Global Stock Market Capitalization from 2000 to 2012 – Stock Market Capitalization by Country from 1990 to 2010 – Historical Stock Returns
A few other companies of interest (based on their market capitalization):
Read more
I have written before about one of the most important changes I believe is needed in thinking about investing over the last few decades: Historical Stock Returns.
My belief is that there has been a fundamental change in the valuation of stocks. Long term data contains a problem in that we have generally realized that stocks are more valuable than realized 100 years ago. That means a higher based PE ratio is reasonable and it distorts at what level stocks should be seen as very overpriced.
It also depresses expected long term returns, see my original post for details.
Jeremy Grantham: The Rules Have Changed for Value Investors
Since 2000, it’s become much more complicated. The rules have shifted. We used to say that this time is never different. I think what has happened from 2000 until today is a challenge to that. Since 1998, price-earnings ratios have averaged 60 percent higher than the prior 50 years, and profit margins have averaged 20 to 30 percent higher. That’s a powerful double whammy.
Diehard Ben Grahamites underestimated what earnings and stock prices would do. That began to be a drag after 1998.
I believe he is right. I believe in the value of paying attention to historical valuation and realizing markets often go to extremes. However, if you don’t account for a fundamental shift in valuation you see the market as overvalued too often.
So why have prices risen so high without a hint of euphoria — at least until very recently — or a perfect economy? My answer is that the discount rate structure has dropped by two percentage points. The yield on stocks is down by that amount and bonds too. The market has adjusted, reflecting low rates, low inflation and high profit margins.
Again I agree. Our political parties have aided big business in undermining market through monopolistic market control and that has been consistent (and increasing) for decades now. It makes stocks more valuable. They have moats due to their monopolistic position. And they extract economic rents from their customers (granted they put a large amount of those ill gotten gains into executives pockets but even so they gains are large enough to increase the value of the stocks).
On top of these strong forces we have the incredible interest rate conditions of the last decade. This is the one that is most worrisome for stock values in my opinion. It servers to boost stock prices (due to the poor returns for interest bearing investments). And I worry at some point this will change.
There is also likely at some point to be a political return to the value of capitalism and allowing free markets to benefit society. But for now we have strong entrenched political parties in the USA that have shown they will undermine market forces and provide monopolistic pricing power to large companies that provide cash to politicians and parties in order to have those parties undermine the capitalist market system.
I believe the stock market in the USA today may well be overvalued. I don’t think it is quite as simple as some of the measures (CAPE – cyclical adjusted PE ratio or market value to USA GDP) make it out to be though. As I have said for several years, I believe we are currently living through one of the more challenging investment climates (for long term investors seeking to minimize long term risk and make decent returns over the long term). I still think it is best just to stick with long term portfolio diversification strategies (though I would boost cash holdings and reduce bonds). And since I am normally light on bonds and high on stocks, for someone like me reducing stock holding for cash is also reasonable I believe (but even doing this I am more in stocks than most portfolio allocations would suggest).
Related: Monopolies and Oligopolies do not a Free Market Make – Misuse of Statistics, Mania in Financial Markets – Interview with Investing Blogger John Hunter
As usual the 2016 Letter to Berkshire Hathaway shareholders by Warren Buffet provides great thoughts for investors.
American business – and consequently a basket of stocks – is virtually certain to be worth far more in the years ahead. Innovation, productivity gains, entrepreneurial spirit and an abundance of capital will see to that. Ever-present naysayers may prosper by marketing their gloomy forecasts. But heaven help them if they act on the nonsense they peddle.
Warren is not a fan of market timing, for good reason. I do think he may be a bit overly-optimistic. It is not something innate about the geography of the USA that means whoever is within that area will prosper over the long term. Our actions as a society materially impact our long term success. Yes, we have done very well economically and we have many factors continuing to make that likely to continue. But it is not certain.
Those willing to challenge rosy projections serve a useful purpose. But investors must be careful not to lose out on gains. Timing the market is rarely successful. Even in the cases where people do reasonable well getting out of a highly priced market they often fail to get back into the market until after they lose money on the effort (they may save a bit on the downside but then don’t get back in until they missed more upside than they saved on the downside).
- understand all exposures that might cause a policy to incur losses;
- conservatively assess the likelihood of any exposure actually causing a loss and the probable cost if it does;
- set a premium that, on average, will deliver a profit after both prospective loss costs and operating expenses are covered; and
- (4) be willing to walk away if the appropriate premium can’t be obtained.
Many insurers pass the first three tests and flunk the fourth. They simply can’t turn their back on business that is being eagerly written by their competitors. That old line, “The other guy is doing it, so we must as well,” spells trouble in any business, but in none more so than insurance.
Must of Berkshire Hathaway’s success is due to what seem like fairly easy things to do. For example, what Warren discusses here. This reinforces a point that is often overlooked which is the management philosophy that has helped Berkshire Hathaway achieve their success. Every year Warren Buffett praises the senior managers at various Berkshire Hathaway companies for good reason.
The fairly simple idea of hiring trustworthy, capable and ethical people and giving them freedom to manage for the long term seems too easy to provide an advantage. But it does. Warren Buffett is very careful to pick people that are more concerned with providing value to customers over the long term than promoting themselves and seeking massive short term rewards for themselves. This simple act of hiring people that are willing to put customers and shareholders before themselves allows your organizations to function in its long term best interest.
In so many other companies short term incentives destroy value (Warren’s point 4 above). This failure can extend to companies Warren is significantly invested in: such as the long term and deep seeded mismanagement at Wells Fargo due to very poor leadership at that company for years. But in general, Berkshire Hathaway is much better at avoiding these toxic behaviors driven by very poor executive leadership when compared to other companies.
The importance of Berkshire Hathaway focusing on the long term and not getting distracted by short term financial measures is vastly under-appreciated.
By focusing managers and CEOs on actually running the business Berkshire Hathaway again does well compared to their competitors. Far too many companies spend the time of executives on playing financial games to divert huge payments to themselves that they then try to claim are not really costs. This is enormously costly to investors and our economy.
Diversification and keeping down fees are the investing strategies that will help more investors than anything else.
Related: Warren Buffett’s 2011 Letter to Shareholders – Warren Buffett’s 2010 Letter to Shareholders – Warren Buffett’s 2005 Shareholder Letter