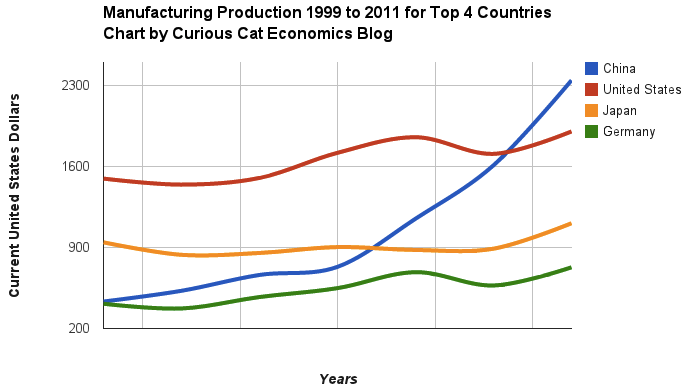
Chart of manufacturing production by China, USA, Japan and Germany from 1999 to 2011. The chart was created by the Curious Cat Economics Blog using UN data. You may use the chart with attribution. All data is shown in current USD (United States Dollar).
The story of global manufacturing production continues to be China’s growth, which is the conventional wisdom. The conventional wisdom however is not correct in the belief that the USA has failed. China shot past the USA, which dropped into 2nd place, but the USA still manufactures a great deal and has continually increased output (though very slowly in the last few years).
The story is pretty much the same as I have been writing for 8 years now. The biggest difference in that story is just that China actually finally moved into 1st place in 2010 and, maybe, the slowing of the USA growth in output (if that continues, I think the USA growth will improve). I said last year, that I expected China to build on the lead it finally took, and they did so. I expect that to continue, but I also wouldn’t be surprised to see China’s momentum slow (especially a few more years out – it may not slow for 3 or 4 more years).
As before, the four leading nations for manufacturing production remain solidly ahead of all the rest. Korea and Italy had manufacturing output of $313 billion in 2011 and Brazil moved up to $308 are in 4-6 place. Those 3 countries together could be in 4th place (ahead of just Germany). Even adding Korea and Italy together the total is short of Germany by $103 in 2011). I would expect Korea and Brazil to grow manufacturing output substantially more than Italy in the next 5 years.
The stock market capitalization by country gives some insight into how countries, and stocks, are doing. Looking at the total market capitalization by country doesn’t equate to the stock holdings by individuals in a country or the value of companies doing work in a specific country.

Chart of largest stock market capitalizations by country from 1990 to 2010
In the chart, I divided the world total by 3: just to make the chart look better. The USA was 32.5% of the total in 1990. The USA grew to 46.9% as the tech, finance and housing bubbles were all underway (also Japan was stagnating and the Chinese stock market hadn’t started booming to a significant extent). In 2010 the USA was back down to 31.4%. This will likely continue to decrease (at a much slower pace – I wouldn’t be surprised to see the USA at 25% in 2020) as the rest of the world’s markets continue to grow more quickly.
As with so much recent economic data China’s performance here is remarkable and Japan’s is distressing. China grew from nothing in 1990 to the 2nd largest country in 2010. Hong Kong add another $1 trillion to China’s $4.5 trillion. Canada is the only country above $2 trillion not included on this chart. China grew by $4 trillion from 2005 to 2010.
Related: Don’t Expect to Spend Over 4% of Your Retirement Investment Assets Annually – Top 10 Countries for Manufacturing Production from 1980 to 2010 –
Investment Risk Matters Most as Part of a Portfolio, Rather than in Isolation – Government Debt as Percent of GDP 1998-2010
 The chart shows the top nuclear power producing countries from 1985 to 2010. The chart created by Curious Cat Investing and Economics Blog may be used with attribution. Data from US Department of Energy.
___________________
Nuclear power provided 14% of the world’s electricity in 2010. Wind power capacity increased 233% Worldwide from 2005 2010, to a total of 2.5% of global electricity needs. Nuclear power generation declined by .72% for the same period.
Burning coal was responsible for 41% of electricity generation in 2010. Burning natural gas accounted for 21% and hydroelectric generation accounted for 15%.
Japan just announced that they have closed their last operating nuclear power plant. They have no nuclear power plant generating electricity for the first time in more than 40 years. It will be interesting to see how low their actual generation totals fall this year. They plan to re-open some of the plants but it is a political issue that is far from settled.
Globally nuclear power production increased 84% from 1985 to 2010. This is a very low percentage. Global output over that period increased much more than that, as did global electricity use. The share of electricity production provided by nuclear power peaked at about 17% for much of the 1990s.
Related: Nuclear Power Production Globally from 1985 to 2009 – Oil Production by Country 1999-2009 – Top 10 Countries for Manufacturing Production from 1980 to 2010: China, USA, Japan, Germany… – Japan to Add Personal Solar Subsidies – Nuclear Energy Institute (statistics)
Another view of data on nuclear power shows which of the leading nuclear producing countries have the largest percentages of their electrical generating capacity provided by nuclear power plants (as of 2009). France has 75% of all electricity generated from nuclear power. Ukraine had the second largest percentage at 49%, then Sweden at 37% and South Korea at 35%. Japan is at 28% compared to 20% for the USA. Russia was at 18% and China was at just 2%.

Chart showing loan delinquency rates from 2001-2011. It shows seasonally adjusted data for all banks for consumer and real estate loans. The chart is available for use with attribution. Data from the Federal Reserve.
2011 saw delinquency rates for loans fall across the board in the USA. Residential real estate delinquency rates fell just 25 basis points (to a still extremely large 9.86%). Commercial real estate delinquency rates fell an impressive 186 basis points (to a still high 6.12%). Credit card delinquency rates fell 86 basis points to a 17 year low, 3.27%.
The job market continues to struggle, though it is doing fairly well the last few months. The serious long term problems created by governments spending beyond their means (for decades) and allowing too big to fail institutions to destroy economic wealth and create great risk to the economy are not easy to solve: and we made no progress in doing so in 2011. The reduction in delinquency rates is a good sign for the economy. The residential real estate delinquency rates are still far too high as is government debt. And the failure to address the too big to fail (big donors to the politicians) is continuing to cause great damage to the economy.
We need to reduce consumer and government debt. Many corporations are actually flush with cash, so at least we don’t have a huge corporate debt problem. Reducing debt load will decrease risks to the economy and provide wealth for consumers to tap as they move into retirement. The too-big-to-fail big political donors like to keep policies in place that encourage too much debt and favor complex financial instruments that they take huge fees from and then let the government deal with the aftermath. The politicians continued favors to too-big-to-fail institutions is very damaging to out economic well being.
Across the board, the wealthy economies are facing a rapidly aging population (the USA is actually acing this at a much slower rate than most other rich countries – which is helpful).
Related: Consumer and Real Estate Loan Delinquency Rates 2000-2011 – Real Estate and Consumer Loan Delinquency Rates 1998-2009 – Government Debt as Percent of GDP 1998-2010 for OECD

Chart of manufacturing production by the top 10 manufacturing countries (2000 to 2010). The chart was created by the Curious Cat Economics Blog. You may use the chart with attribution. All data is shown in 2010 USD (United States Dollar).
In my last post I looked at the output of the top 10 manufacturing countries with a focus on 1980 to 2010. Here I take a closer look at the last 10 years.
In 2010, China took the lead as the world’s leading manufacturing country from the USA. In 1995 the USA was actually very close to losing the lead to Japan (though you wouldn’t think it looking at the recent data). I believe China will be different, I believe China is going to build on their lead. As I discussed in the last post the data doesn’t support any decline in Chinese manufacturing (or significant moves away from China toward other South-East Asian countries). Indonesia has grown quickly (and have the most manufacturing production, of those discussed), but their total manufacturing output is less than China grew by per year for the last 5 years.
The four largest countries are pretty solidly in their positions now: the order will likely be China, USA, Japan, Germany for 10 years (or longer): though I could always be surprised. In the last decade China relentlessly moved past the other 3, to move from 4th to 1st. Other than that though, those 3 only strengthened their position against their nearest competitors. Brazil, Korea or India would need to increase production quite rapidly to catch Germany sooner. After the first 4 though the situation is very fluid.
")
Taking a closure look at the large group of countries after top 4. Chart of manufacturing production from 2000-2010.
Chart of manufacturing production by the leading manufacturing countries (2000 to 2010). The top 4 countries are left off to look more closely at history of the next group. The chart was created by the Curious Cat Economics Blog based on UN data. You may use the chart with attribution.
Removing the top 4 to take a close look at the data on the other largest manufacturing countries we see that there are many countries bunched together. It is still hard to see, but if you look closely, you can make out that some countries are growing well, for example: Brazil, India and Indonesia. Other countries (most in Europe, as well as Mexico) did not fare well in the last decade.
The UK had a particularly bad decade, moving from first place in this group (5th in the world) to 5th in this group and likely to be passed by India in 2011. Europe has 4 countries in this list (if you exclude Russia) and they do not appear likely to do particularly well in the next decade, in my opinion. I would certainly expect Brazil, India, Korea and Indonesia to out produce Italy, France, UK and Spain in 2020. In 2010 the total was $976 billion by the European 4 to $961 billion by the non-European 4. In 2000 it was $718 billion for the European 4 to $343 billion (remember all the data is in 2010 USD).

Chart of output by top 10 manufacturing countries from 1980 to 2010. The chart was created by the Curious Cat Economics Blog based on UN data. You may use the chart with attribution.
China has finally actually taken the lead as the largest manufacturer in the world. Reading many news sources and blogs you may have thought the USA lost the lead a couple of decades ago, but you would be wrong. In 1995 it looked like Japan was poised to take the lead in manufacturing production, but they have slumped since then (still they are solidly the 3rd biggest manufacturer). China has been growing manufacturing output enormously for 20 years, and they have now taken the lead from the USA.
As I have been saying for years the biggest economic story about manufacturing is the dramatic and long term increase of productive capacity in China. The next is the continuing global decline in manufacturing employment: increased productivity has seen production rise year after year and employment fall. What is the next most interesting stories is debatable: I would say the continuing failure to appreciate the continuing strong manufacturing production increases by the USA. Another candidate is the the decline in Japan. Another is the increase in several other counties: Korea, Brazil, India, Indonesia…
Looking more closely at some of the long term data shows how much China stands out. From 1980 to 2010 China increased output 1345%. The total top 10 group increased output 302% (all data is in current USD so inflation accounts for most of the gain, 100 1980-USD equal 280 2010-USD). From 1995 to 2010 China increased output 543%. The group increased 64%. For 1980-2010, the results for the other 3 largest manufacturing countries are: USA up 218%, Japan up 261% and Germany up 148% (other countries doing very well are Korea up 1893% and India up 737%). Looking at the last half of that period, from 1995-2010 the: USA up 44%, Japan down 11% and Germany up 19%.
One thing to remember about adjusting manufacturing data for inflation is that often the products created in later years are superior and cost less. So that a computer manufactured in 1990 which added $5,000 to the manufacturing total is far inferior to one in 2010 that added just $1,000. This point is mainly to say that while the increase in manufacturing in real (not inflated dollars) is not as high as it might seem the real value of manufacturing good did likely increase a great deal. But the economic data is based on price so manufacturing increases are reduced by cost decreases. Computers are the most obvious example, but it is also true with many other manufactured goods.
You can that the other largest manufacturing countries fail to keep up with the increases of the entire group of the top 10. China’s gains are just too large for others to match. If you remove China’s results (just to compare how the non-China countries are doing) from 1980-2010 the increase was 216% (so compared to the other 9 top manufacturers over this period the USA was even and Japan better than the average and Germany was worse). And from 1995-2010 the top 9 group (top 10, less China) increased just 28%: so the USA beat while Japan and Germany did worse than the other 9 as a group.
 Chart by Curious Cat Economics Blog using data from the Wind Energy Association. 2011 data is for the capacity on June 30, 2011. Chart may be used with attribution as specified here.
_________________________
In 2007 wind energy capacity reached 1% of global electricity needs. In just 4 years wind energy capacity has grown to reach 2.5% of global electricity demand. And by the end of 2011 it will be close to 3%.
By the end of 2011 globally wind energy capacity will exceed 240,000 MW of capacity. As of June 30, 2011 capacity stood at 215,000. And at the end of 2010 it was 196,000.
As the chart shows Chinese wind energy capacity has been exploding. From the end of 2005 through the end of 2011 they increased capacity by over 3,400%. Global capacity increased by 233% in that period. The 8 countries shown in the chart made up 79% of wind energy capacity in 2005 and 82% at the end of 2010. So obviously many of other countries are managing to add capacity nearly as quickly as the leading countries.
USA capacity grew 339% from 2005 through 2010 (far below China but above the global increase). Germany and Spain were leaders in building capacity early; from 2005 to 2010 Germany only increased 48% and Spain just 106%. Japan is an obvious omission from this list; given the size of their economy. Obviously they have relied heavily on nuclear energy. It will be interesting to see if Japan attempts to add significant wind and solar energy capacity in the near future.
Related: Nuclear Power Production by Country from 1985-2009 – Top Countries For Renewable Energy Capacity – Wind Power Capacity Up 170% Worldwide from 2005-2009 – USA Wind Power Installed Capacity 1981 to 2005 – Oil Consumption by Country 1990-2009
This chart shows government debt as a percent of GDP based on OECD data. The chart is limited to central government debt issuance and excludes therefore state and local government debt and social security funds.

Economic data is always a bit tricky to understand. It makes some sense that excluding social security would reduce the USA debt percentage a bit. But these debt as a percentage of GDP are lower than other sources show. There are obviously many tricks that can be used to hide debt and my guess is the main thing going on with this data is OECD intentionally trying to make things look as good as possible.
Still looking at historical trends in data is useful. And I believe looking at data from various sources is wise. There has been a dramatic increase from 2008-2010. The USA is up from 41% of GDP to 61%. Spain is up from 34% to 52% (but given all the concern with Spain this doesn’t seem to indicate the real debt problems they have.
Japan and France don’t have 2010 data, so I used a rough estimate of my own based on 2009 data. Greece has been over 100% since 1998 and now stands at 148%, 2nd worst (to Japan) for any OECD country (Europe, North America, Japan and Korea), Italy is 3rd. Ireland is at 61% (up from 28% in 2008). The UK is at 86%, up from 61%.
Related: Government Debt as Percentage of GDP 1990-2009: USA, Japan, Germany, China… (based on IMF data) – Government Debt as Percentage of GDP 1990-2008 – Government Debt Compared to GDP 1990-2007 – Top 15 Manufacturing Countries in 2009
The chart shows the total percent of delinquent loans by commercial banks in the USA.

The second half of 2010 saw real estate, agricultural, credit card and other loan delinquencies decrease. The rates are still quite high but at least are moving in the right direction. Residential real estate delinquencies decreased 138 basis points in the second half of 2010, to 9.94%, which brought them to just below the rate at the end of 2009. In the second half of 2010, commercial real estate delinquencies decreased 77 basis points to 7.97% (which was also exactly 77 basis points less than at the end of 2009. Agricultural loan delinquencies decreased 76 basis points, to 2.55% (down 53 basis points from the end of 2009). Consumer loan delinquencies decreased, with credit card delinquencies down 90 basis points to 4.17% and other consumer loan delinquencies down 27 basis points to 3.1%. The credit card delinquency rate decreased a very impressive 219 basis points in 210.
Related: Real Estate and Consumer Loan Delinquency Rates 2000 through June 2010 – Real Estate and Consumer Loan Delinquency Rates 1998-2009 – Bond Rates Remain Low, Little Change in Late 2009 – posts with charts showing economic data
Read more
 The chart shows the leading nuclear power producing countries from 1985-2009. The chart created by Curious Cat Investing and Economics Blog may be used with attribution. Data from US Department of Energy.
___________________
Nuclear power provided 14% of the world’s electricity in 2009. Wind power capacity increased 170% Worldwide from 2005-2009, to a total of 2% of electricity used (38,025 Megawatts of capacity). The USA produced nearly twice as much electricity using nuclear power than any other country, which surprised me.
Another view of data on nuclear power shows which of the leading nuclear producing countries have the largest percentages of their electrical generating capacity provided by nuclear power plants (as of 2009). France has 75% of all electricity generated from nuclear power. Ukraine had the second largest percentage at 49%, then Sweden at 37% and South Korea at 35%. Japan is at 28% compared to 20% for the USA (I am surprised these are so close _ would have thought France and Japan would be much closer). Russia is at 18% and China was at just 2%. As of January 2011, 29 countries worldwide are operating 442 nuclear reactors for electricity generation and 65 new nuclear plants are under construction in 15 countries. Source, Nuclear Energy Institute.
From 1985 to 2009, USA production increased 108%, France 84% and Japan up 77%. South Korea is up 550% (from a very low starting point). Globally nuclear power production increased 80% from 1985 to 2009. From 2000-2009 production increased 5% in the USA and decreased by 1% in France and 13% in Japan. China was up 318% (from a very low level) from 2000-2009 (they did not have nuclear power capacity prior to 1995.
The global capacity of nuclear power was scheduled to increase more rapidly in the future before the earthquake in Japan and the crisis at the Kashiwazaki-Kariwa Nuclear Power Plant. China was going to add a great deal of capacity and is likely to over the next few years (nuclear power plants take many year to bring online so those coming online in the next few years have already had hundreds of millions invested in building them). Several European countries have already announced temporary closing of some plants (especially some plants nearing the end of their originally scheduled lives – which those countries had been in the process of extending).
As a comparison global oil production increased by 10.5% from 1999-2009, while nuclear global production increased by 5% from 2000-2009. From 1999-2009 USA oil production decreased 7%. Russia increased production 62% in the decade, moving it into first place ahead of Saudi Arabia that increased production 10%.
Related: Oil Production by Country 1999-2009 – Oil Consumption by Country 1990-2009 – Japan to Add Personal Solar Subsidies – Solar Thermal in Desert, to Beat Coal by 2020